Without doubt, the most effective way to create powerful web or mobile apps with minimal code is achieved by harnessing the power of SQL in your data sources. We’ve used variations of SELECT * FROM DEMOCMAST in countless examples here over the years, and likely you’ve leveraged that concept in many of your own applications as well. The columns returned by SQL automatically propagate into your widgets, and with some quick configurations you can have a ready-to-run app for your users in no time.

In this month’s tip we’ll take this SQL concept a step further and introduce the use of virtual variables that make it possible to add another dimension of power and flexibility to your Nitro App Builder apps. A virtual variable refers to any external data, such as a user filter or something provided by an external RPG program as an App Variable, that can be pulled into any part of your SQL statement. This is typically employed in the SELECT, ORDER BY or WHERE clause — including ones inside a WITH clause — providing powerful ways to filter or sort the result set, or add additional information in the columns displayed to the user.
vvIn_virtual() is the NAB-specific function that facilitates these on-the-fly substitutions in your SQL data sources at run time. As of the latest Valence 6 build (6.0.20210421.0), this function accepts up to six parameters, the first four being mandatory:
- variable name – the name of the filter, session variable or app variable
- default value – value to use when variable is not found
- variable type – ‘num’ for numeric values, ‘char’ for character values, ‘date’ for dates
- size – the number of characters or numeric digits in the variable
- decimal places (if ‘num’) – assumed to be zero if not passed
- wrap in quotes (boolean) – set to ‘true’ or ‘false’ to explicitly control when to include or omit quotes around the value (new parameter as of 6.0.20210421.0). Assumed to be true if not passed.
Note the hierarchy on the variable name… NAB will first search for a matching filter name in the app. If no match is found, then it will look for a session variable of the same name. If no matching session variable is found then it will defer to an App Variable of the same name.
The second parameter is the default value NAB will use whenever the specified variable name is not found, as would be the case when you’re creating the data source before it’s attached to any widgets. For example, consider the following SQL statement:
select CUSNO, CNAME, CCOUNTRY,
       case when CCOUNTRY=vvIn_virtual('country','Italy','char',20)
            then 'true' else 'false' end as ISRELEVANT
  from DEMOCMAST
 order by CUSNO
This simple statement looks for a variable (meaning a filter value / session variable / app variable) called “country” and applies it to the SQL statement’s SELECT clause, replacing the vvIn_virtual() segment accordingly. Presumably the isRelevant column would be rendered in your grid as a check box, or used to change the color of another cell to draw attention to it when it matches the value of, say, a combo box filter. When no “country” variable is found (i.e., when you’re developing the data source, or if at run time your application doesn’t pass it for some reason) then the statement becomes this:
select CUSNO, CNAME, CCOUNTRY,
       case when CCOUNTRY='Italy'
            then 'true' else 'false' end as ISRELEVANT
  from DEMOCMAST
 order by CUSNO
With that in mind, let’s move on to a quick hands-on demonstration of vvIn_virtual. In the steps that follow we will create a simple app containing a standard column chart of customer sales, where for added flair we’ll give users the ability to flip the x axis between City and State. We’ll start the process by creating an SQL-based data source to provide the pertinent x/y data for the chart.
Using the basic customer master file included with Valence, our SQL statement for the data source should look like this:
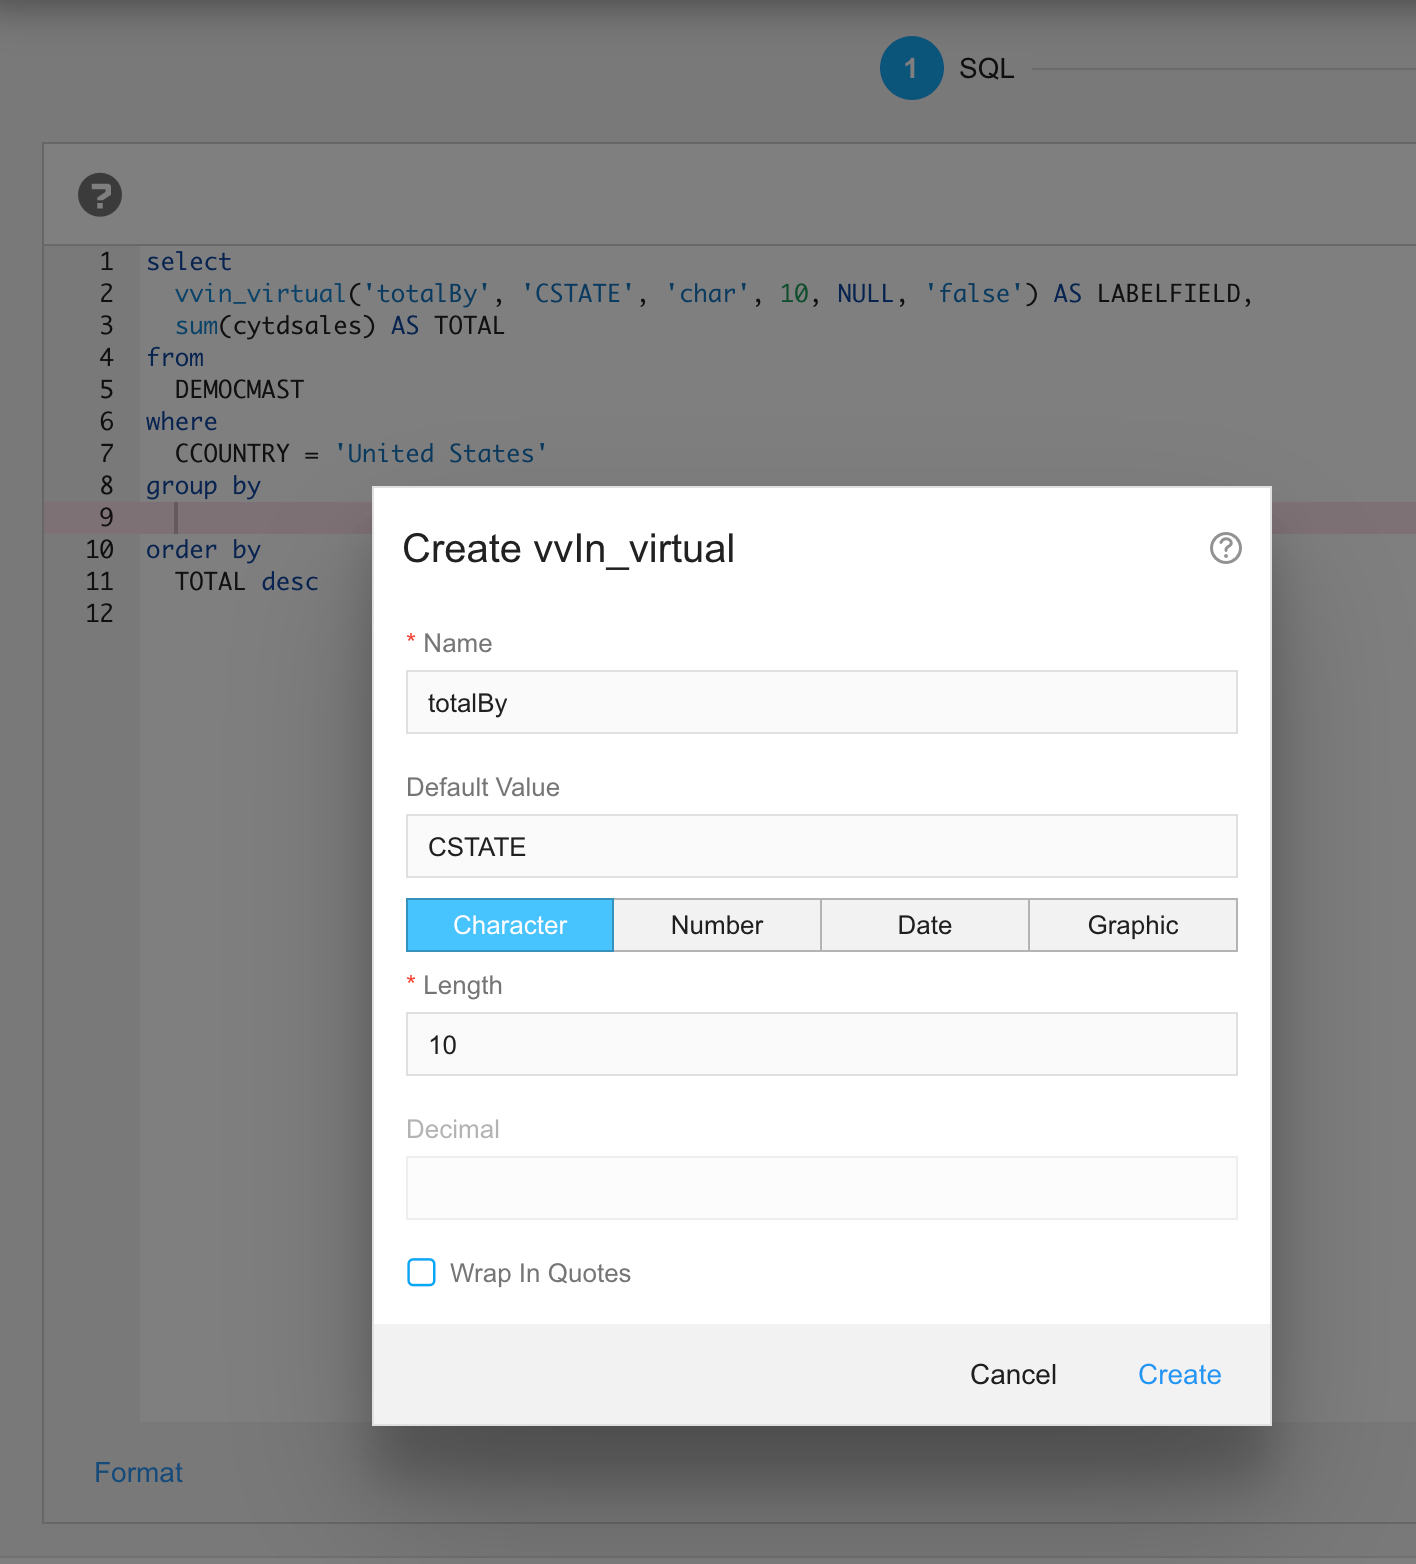
select vvIn_virtual('totalBy','CSTATE','char',10,null,'false')
       as LABELFIELD, sum(CYTDSALES) as TOTAL
  from DEMOCMAST
 where CCOUNTRY='United States'
 group by vvIn_virtual('totalBy','CSTATE','char',10,null,'false')
 order by TOTAL desc
Here, the SELECT and GROUP BY portion of the SQL statement are being set to CSTATE by default, with the ‘false’ parameter indicating the CSTATE text should not be wrapped in quotes since it’s being used as an override to a column name, not supplied as a literal. Note that while inside the SQL editor for NAB you can right-click over any part of the statement get a prompt window to insert the vvIn_virtual() function:
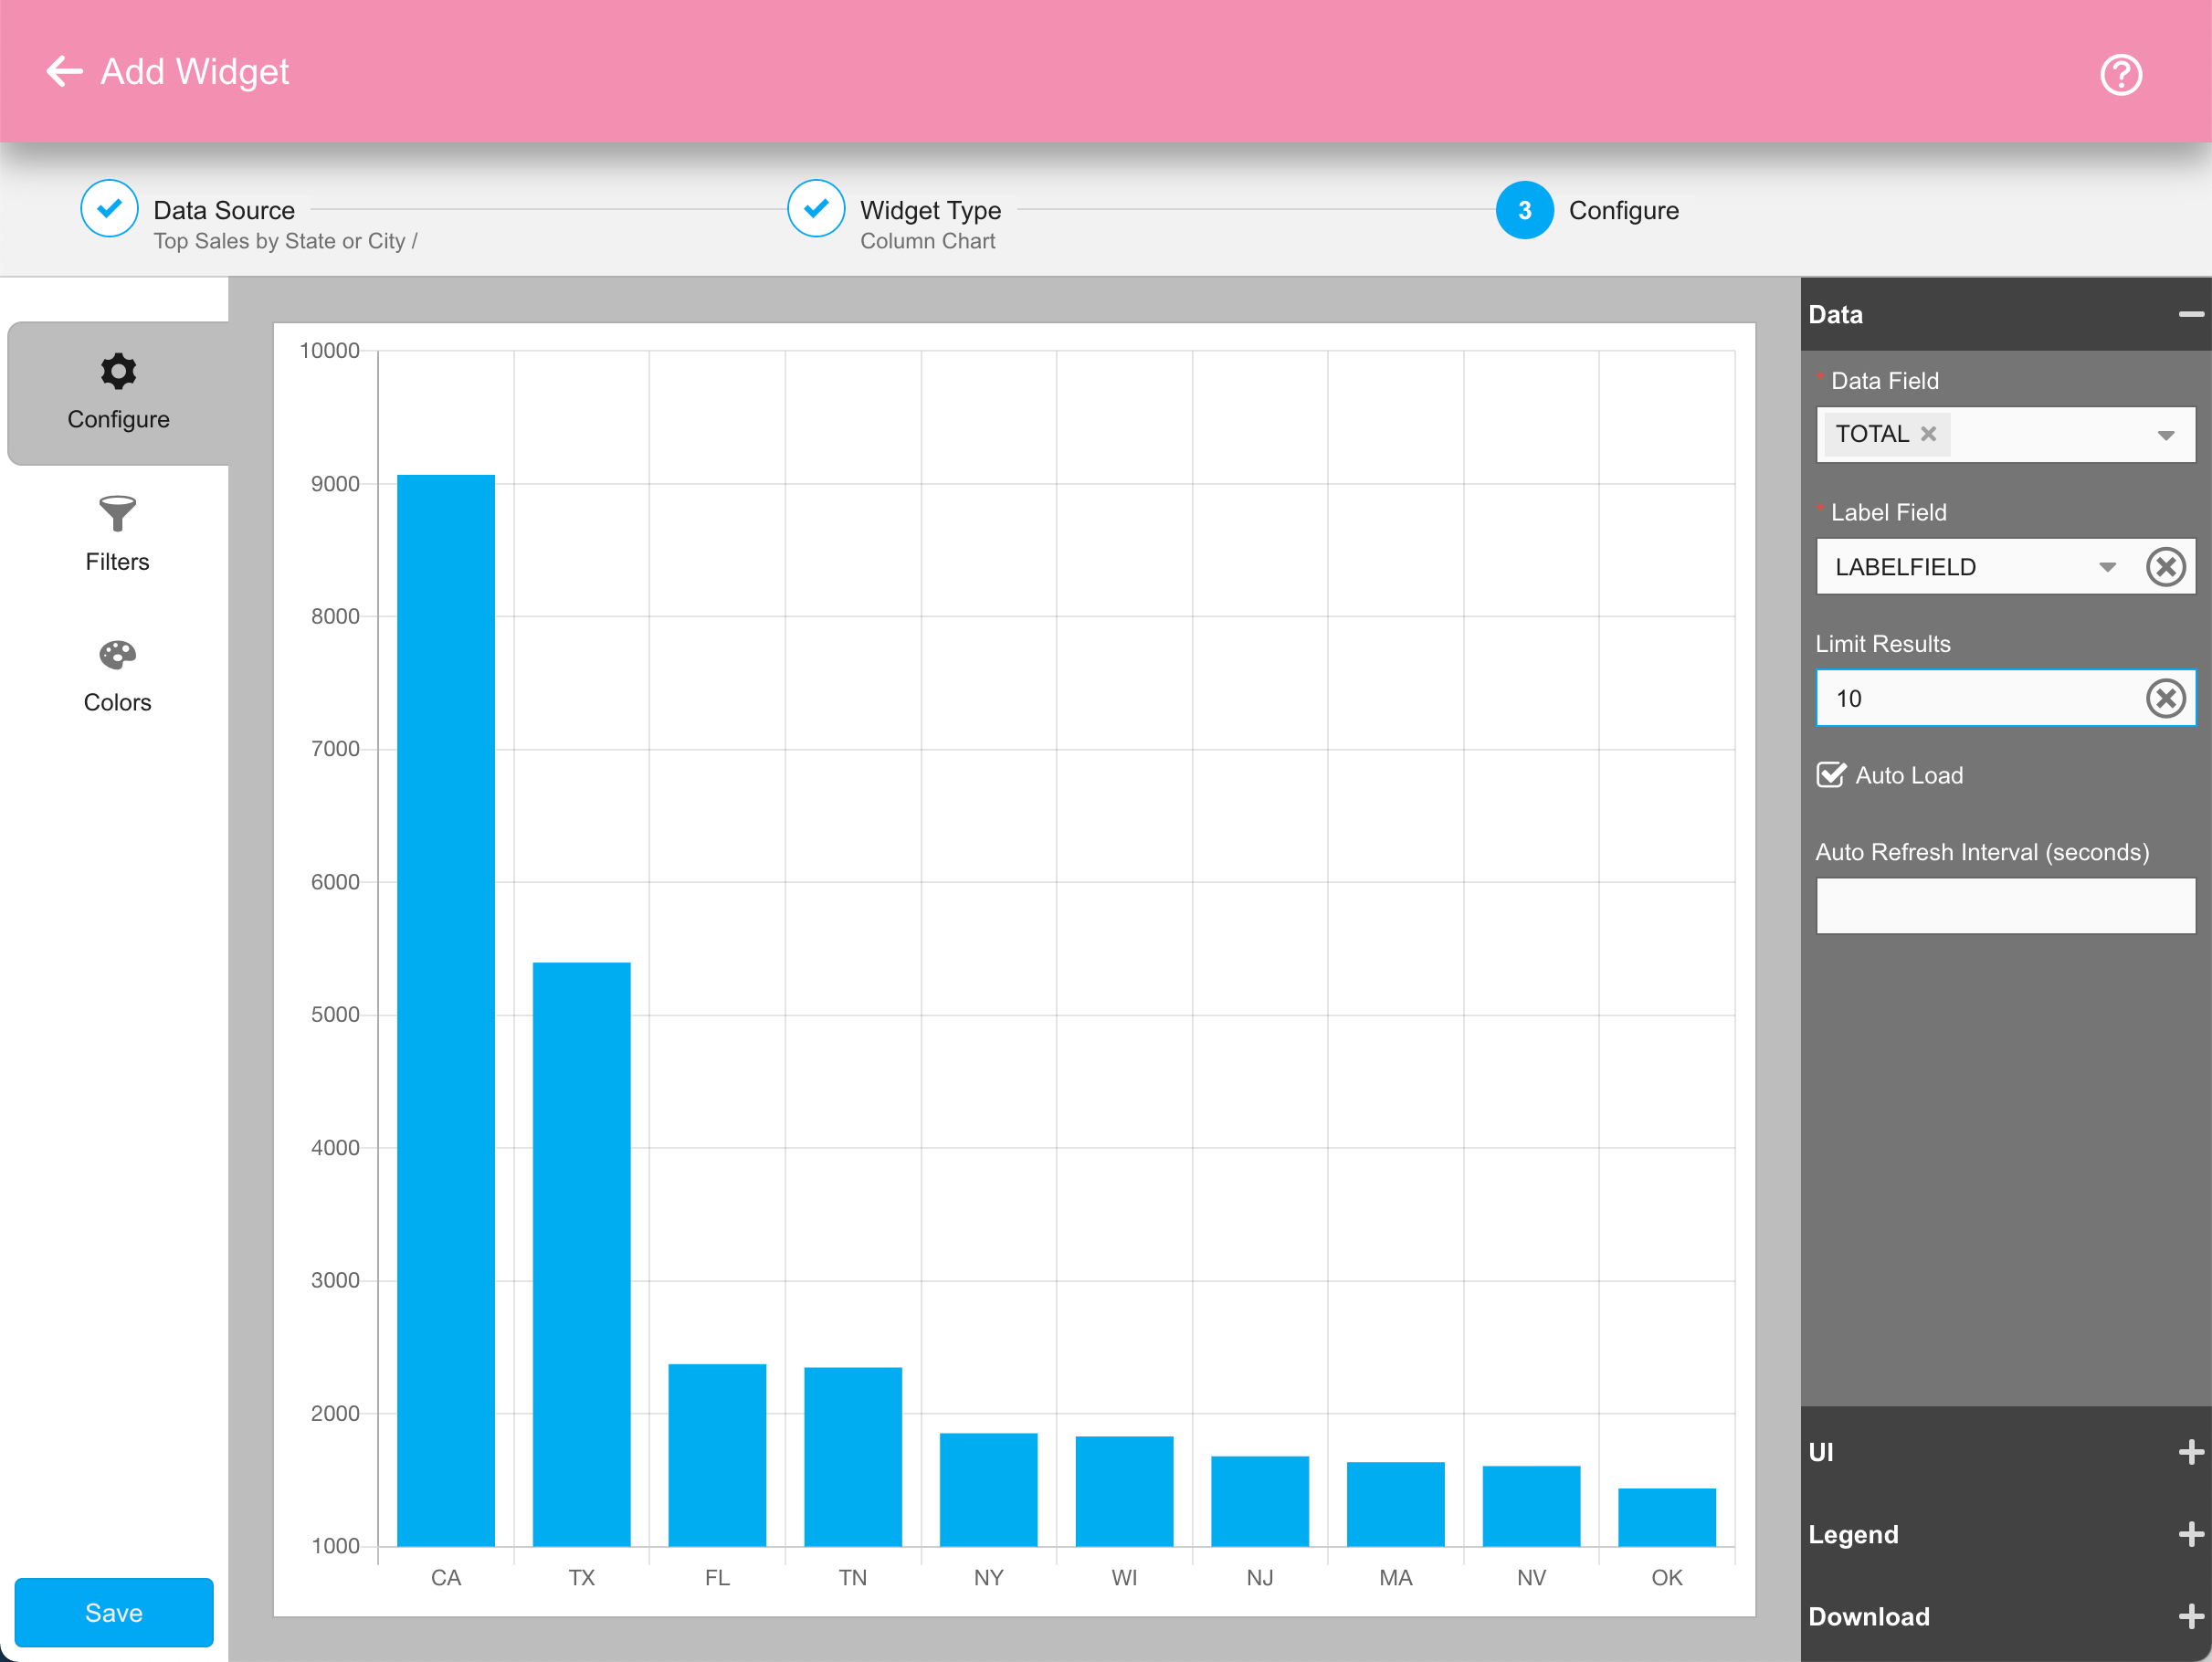
Save this data source, then we can move on to creating a column chart widget to visualize the data. Your chart widget configuration should look like this, limiting the results to the top ten:
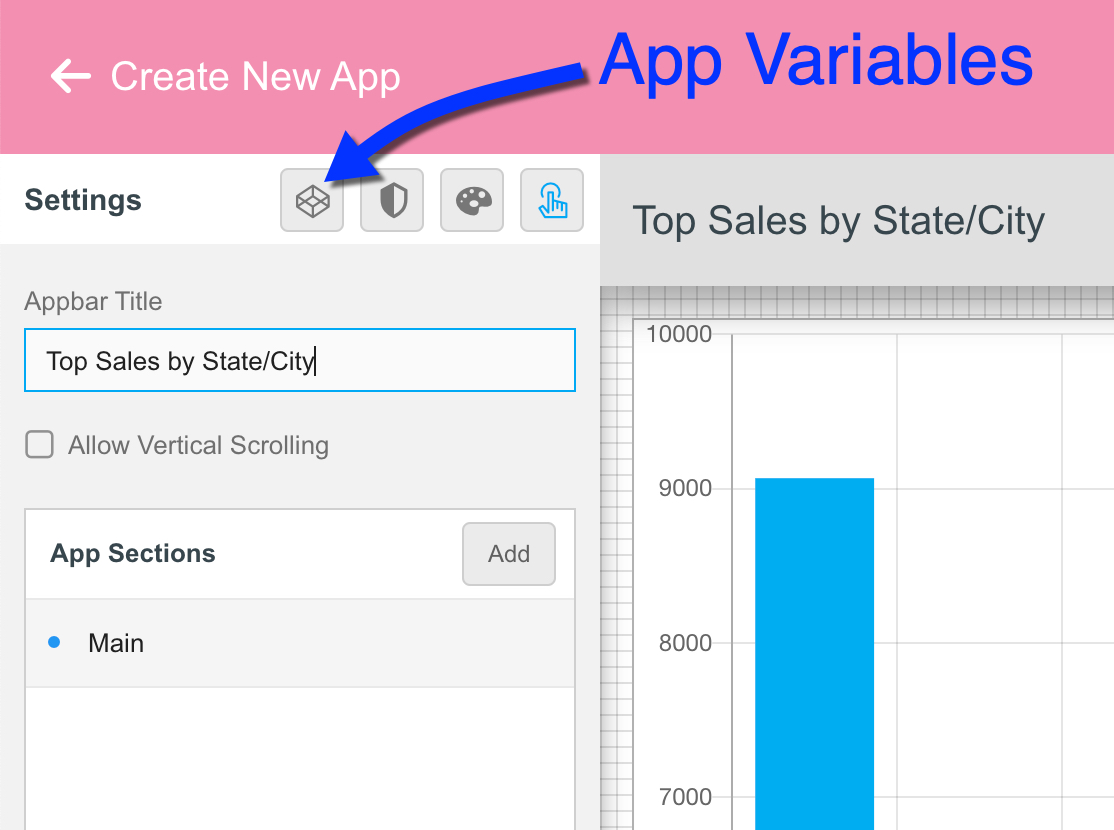
Once that widget is saved, our final step is to create the app so users can access it. So flip to the Apps tab, hit the plus sign in the lower right to start a new app and add the chart widget we just created above. Based on the default value specified in our vvIn_virtual() setup, the chart will initially be listing top states. Now we need to give users a way to flip the chart’s axis to city names. To do that we’ll create an App Variable to hold the column name we’re totaling by, which will be pulled in by the vvIn_virtual function when the data source is executed. So click on the App Variables button…
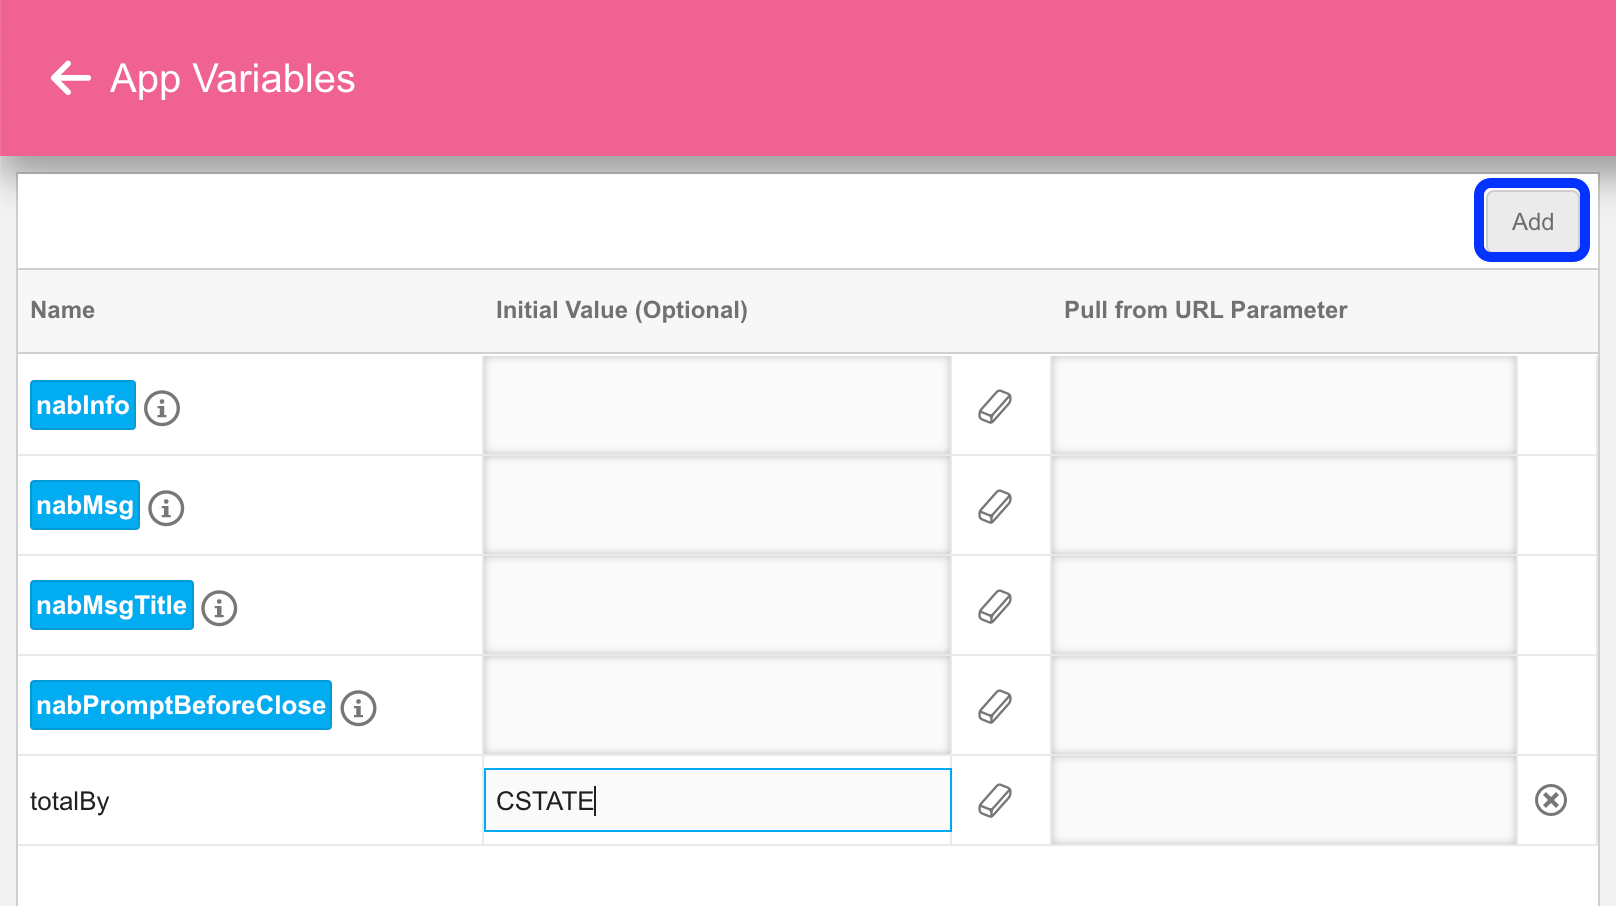
…then add a “totalBy” App Variable (the name must exactly match the vvIn_virtual parameter specified in the data source) and set it to CSTATE.
Finally, we need to provide a way to let the users swap the axis column between state and city. So return to the main app design page and click on Behaviors…
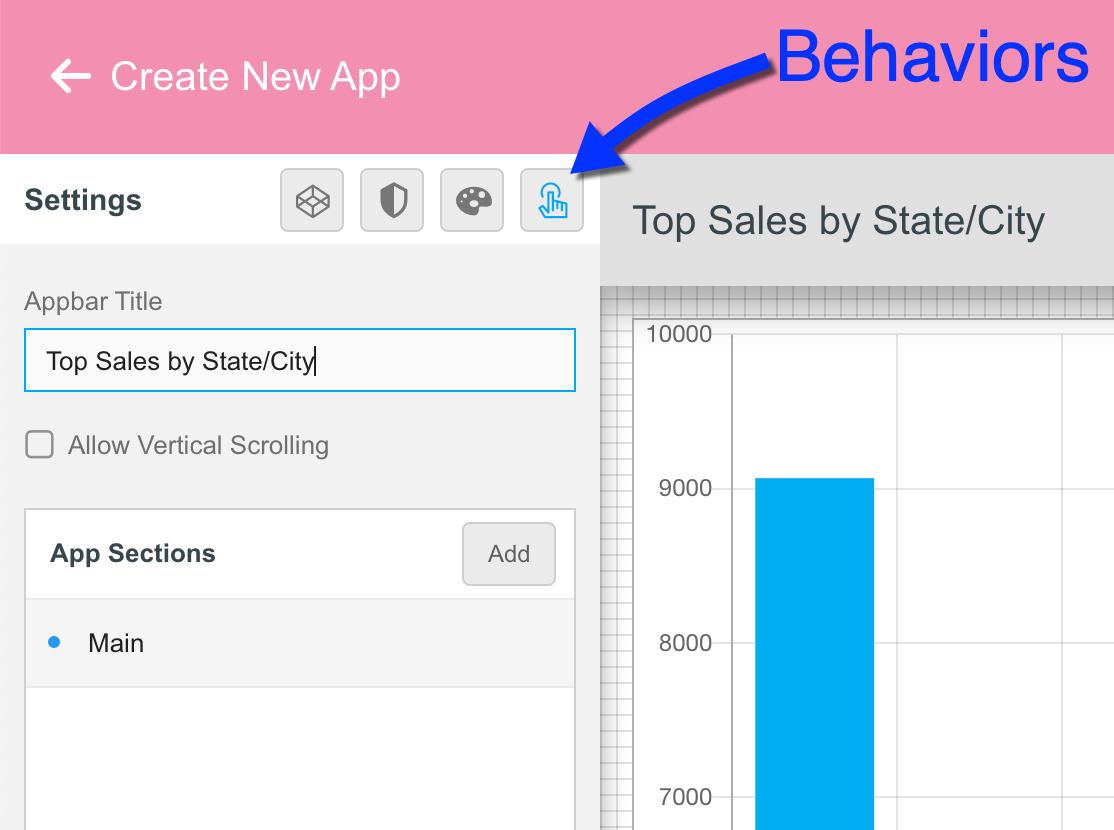
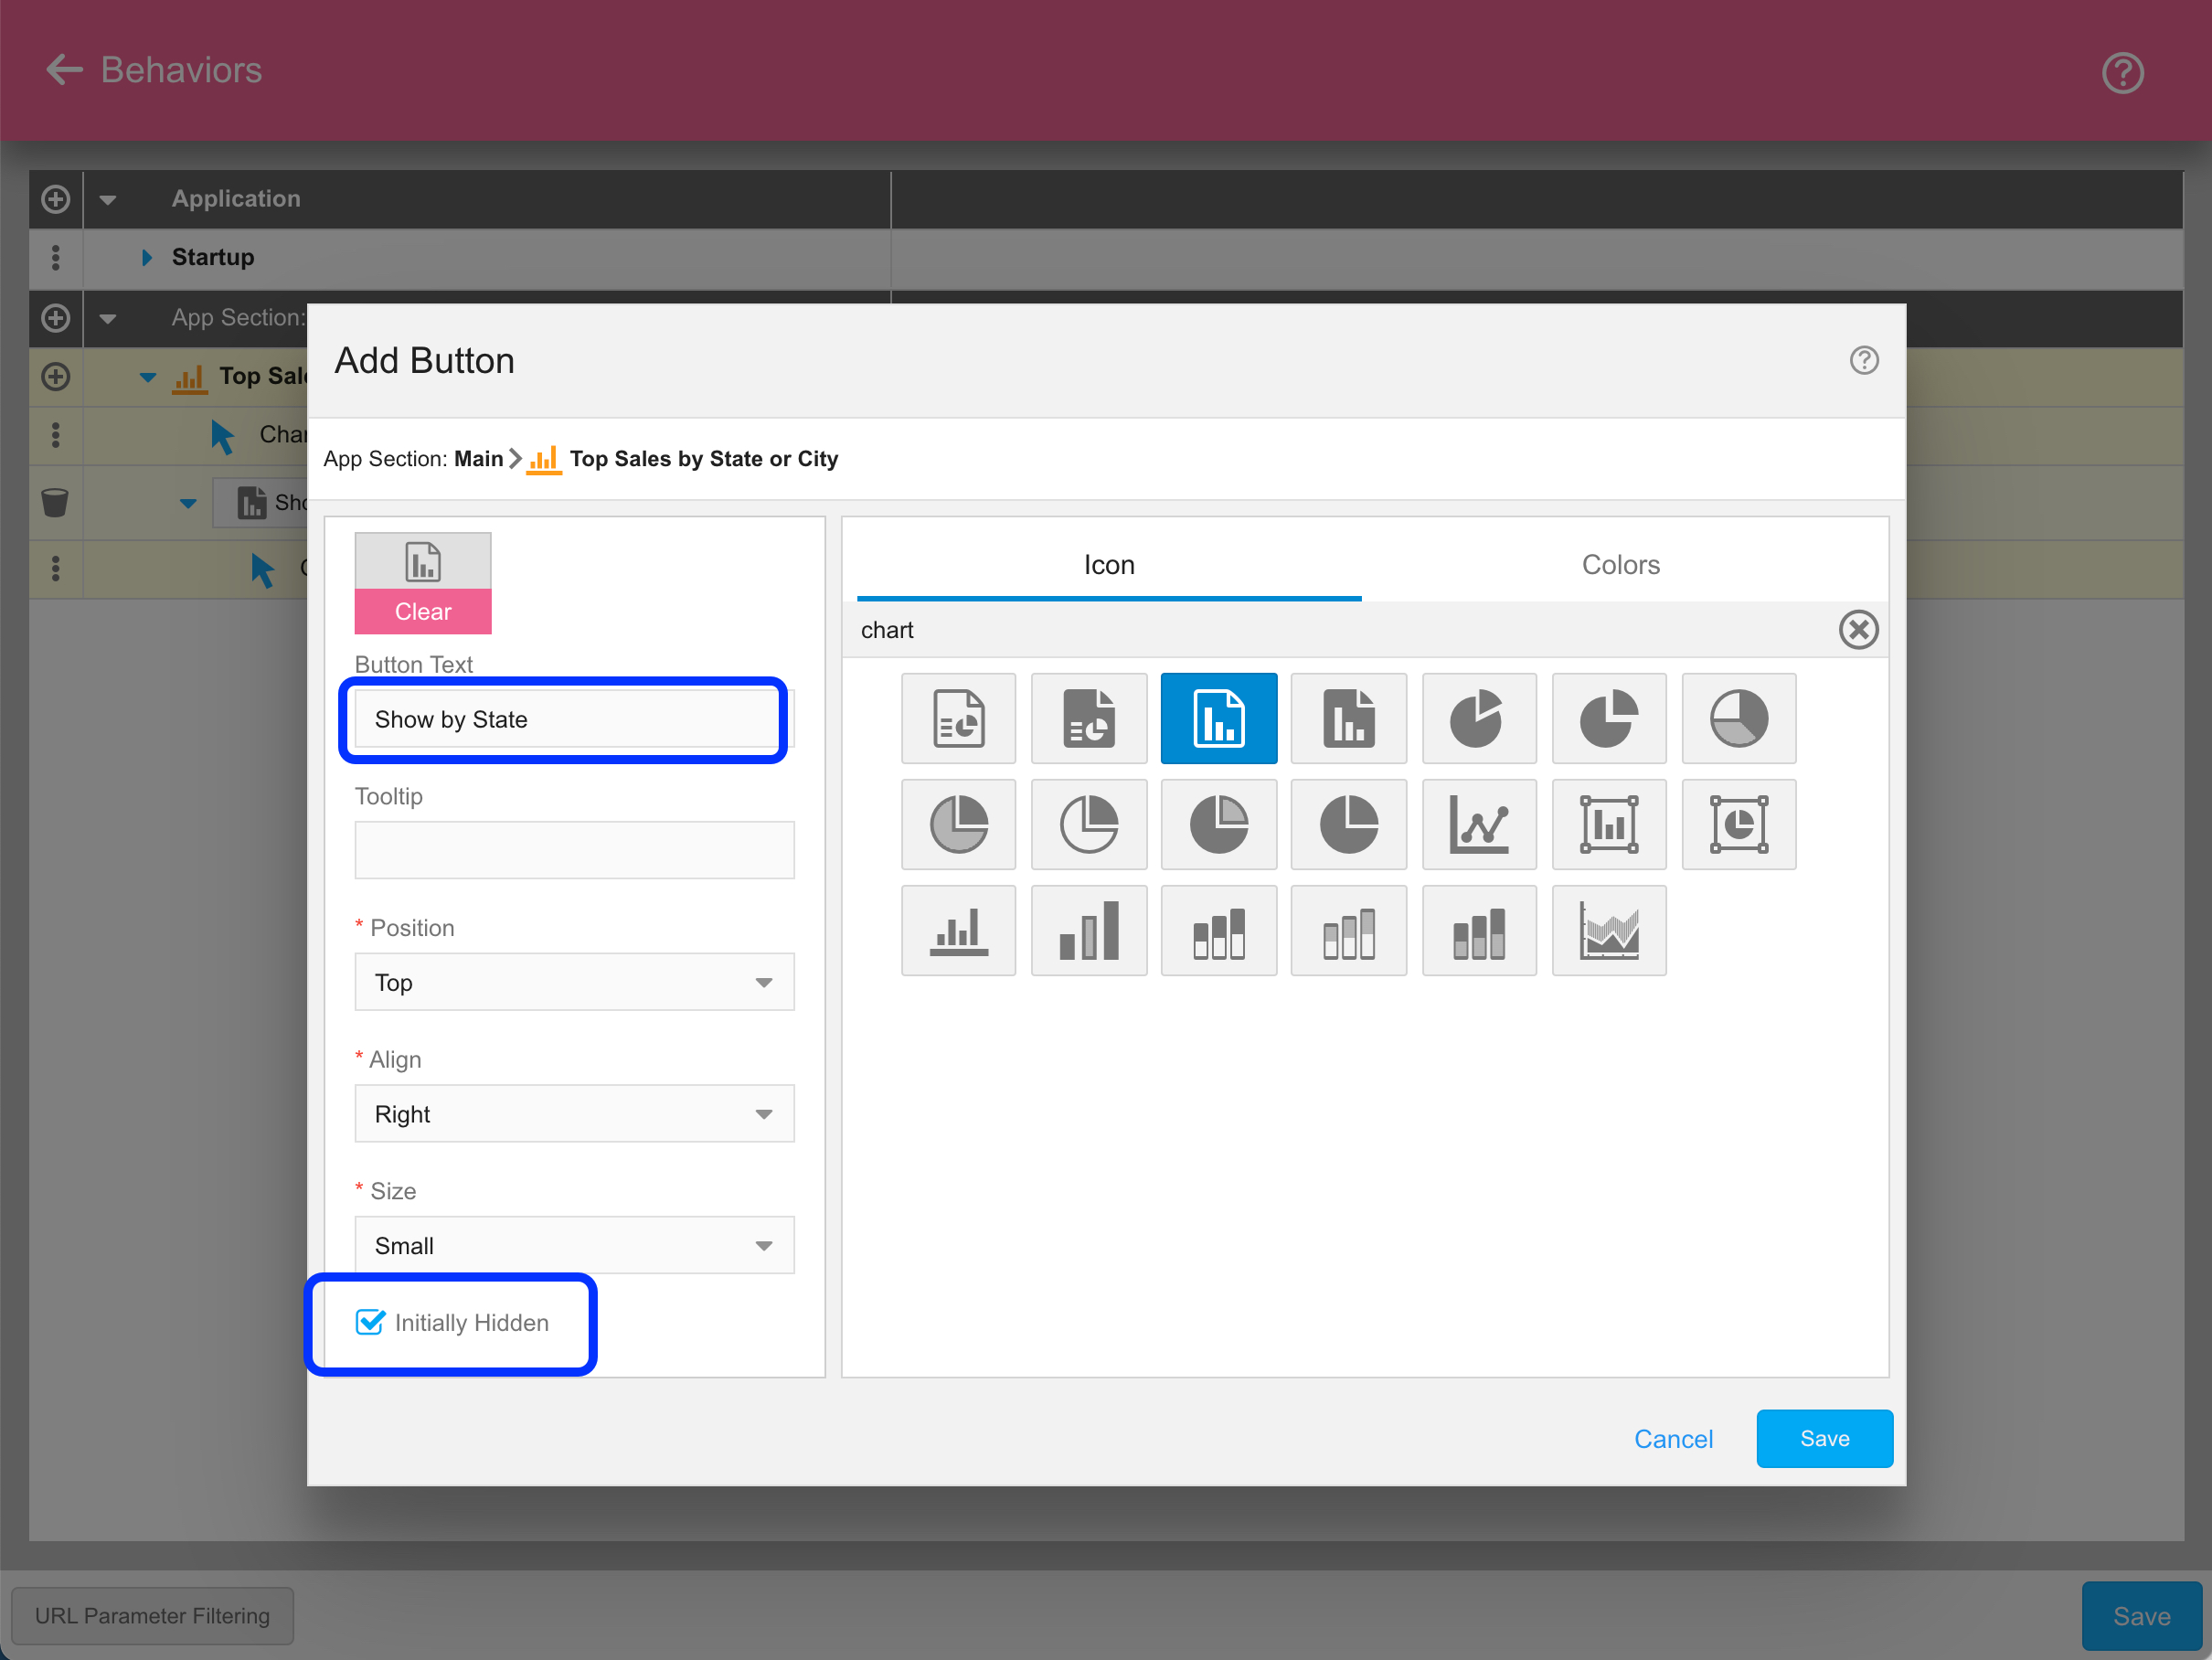
…and add a button to the chart by clicking the plus button just to the left of the chart widget. The text for the button should be set to something like “Show by City”. Repeat this process to add another button entitled “Show by State”, but on this one check the “Initially Hidden” checkbox since we don’t want this to show when the app first loads and the x axis is already set to CSTATE. Feel free to add an icon if you like, as shown here:
Click OK and you’ll see we now have two separate buttons. The next step is to define the actions to take when each button is clicked. This is done by hitting the three dots to the left of the “On Click” row…
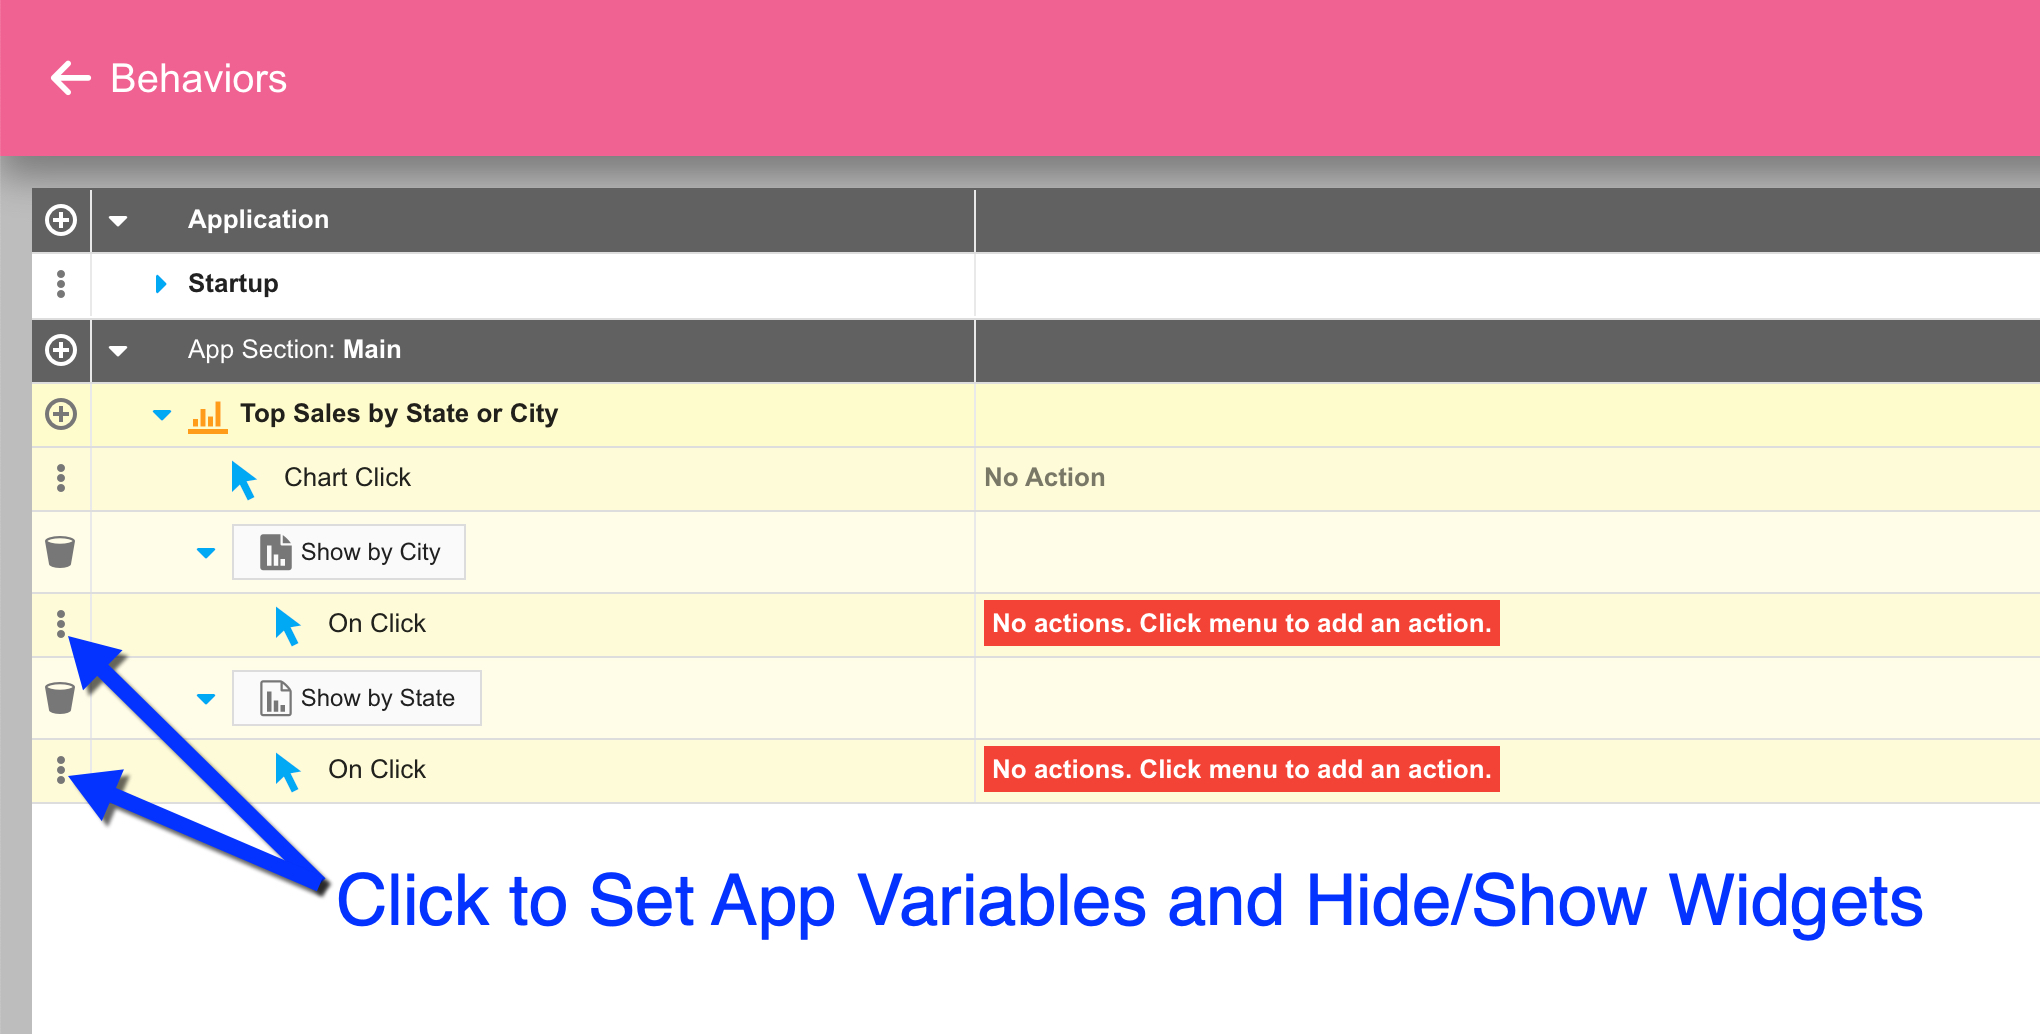
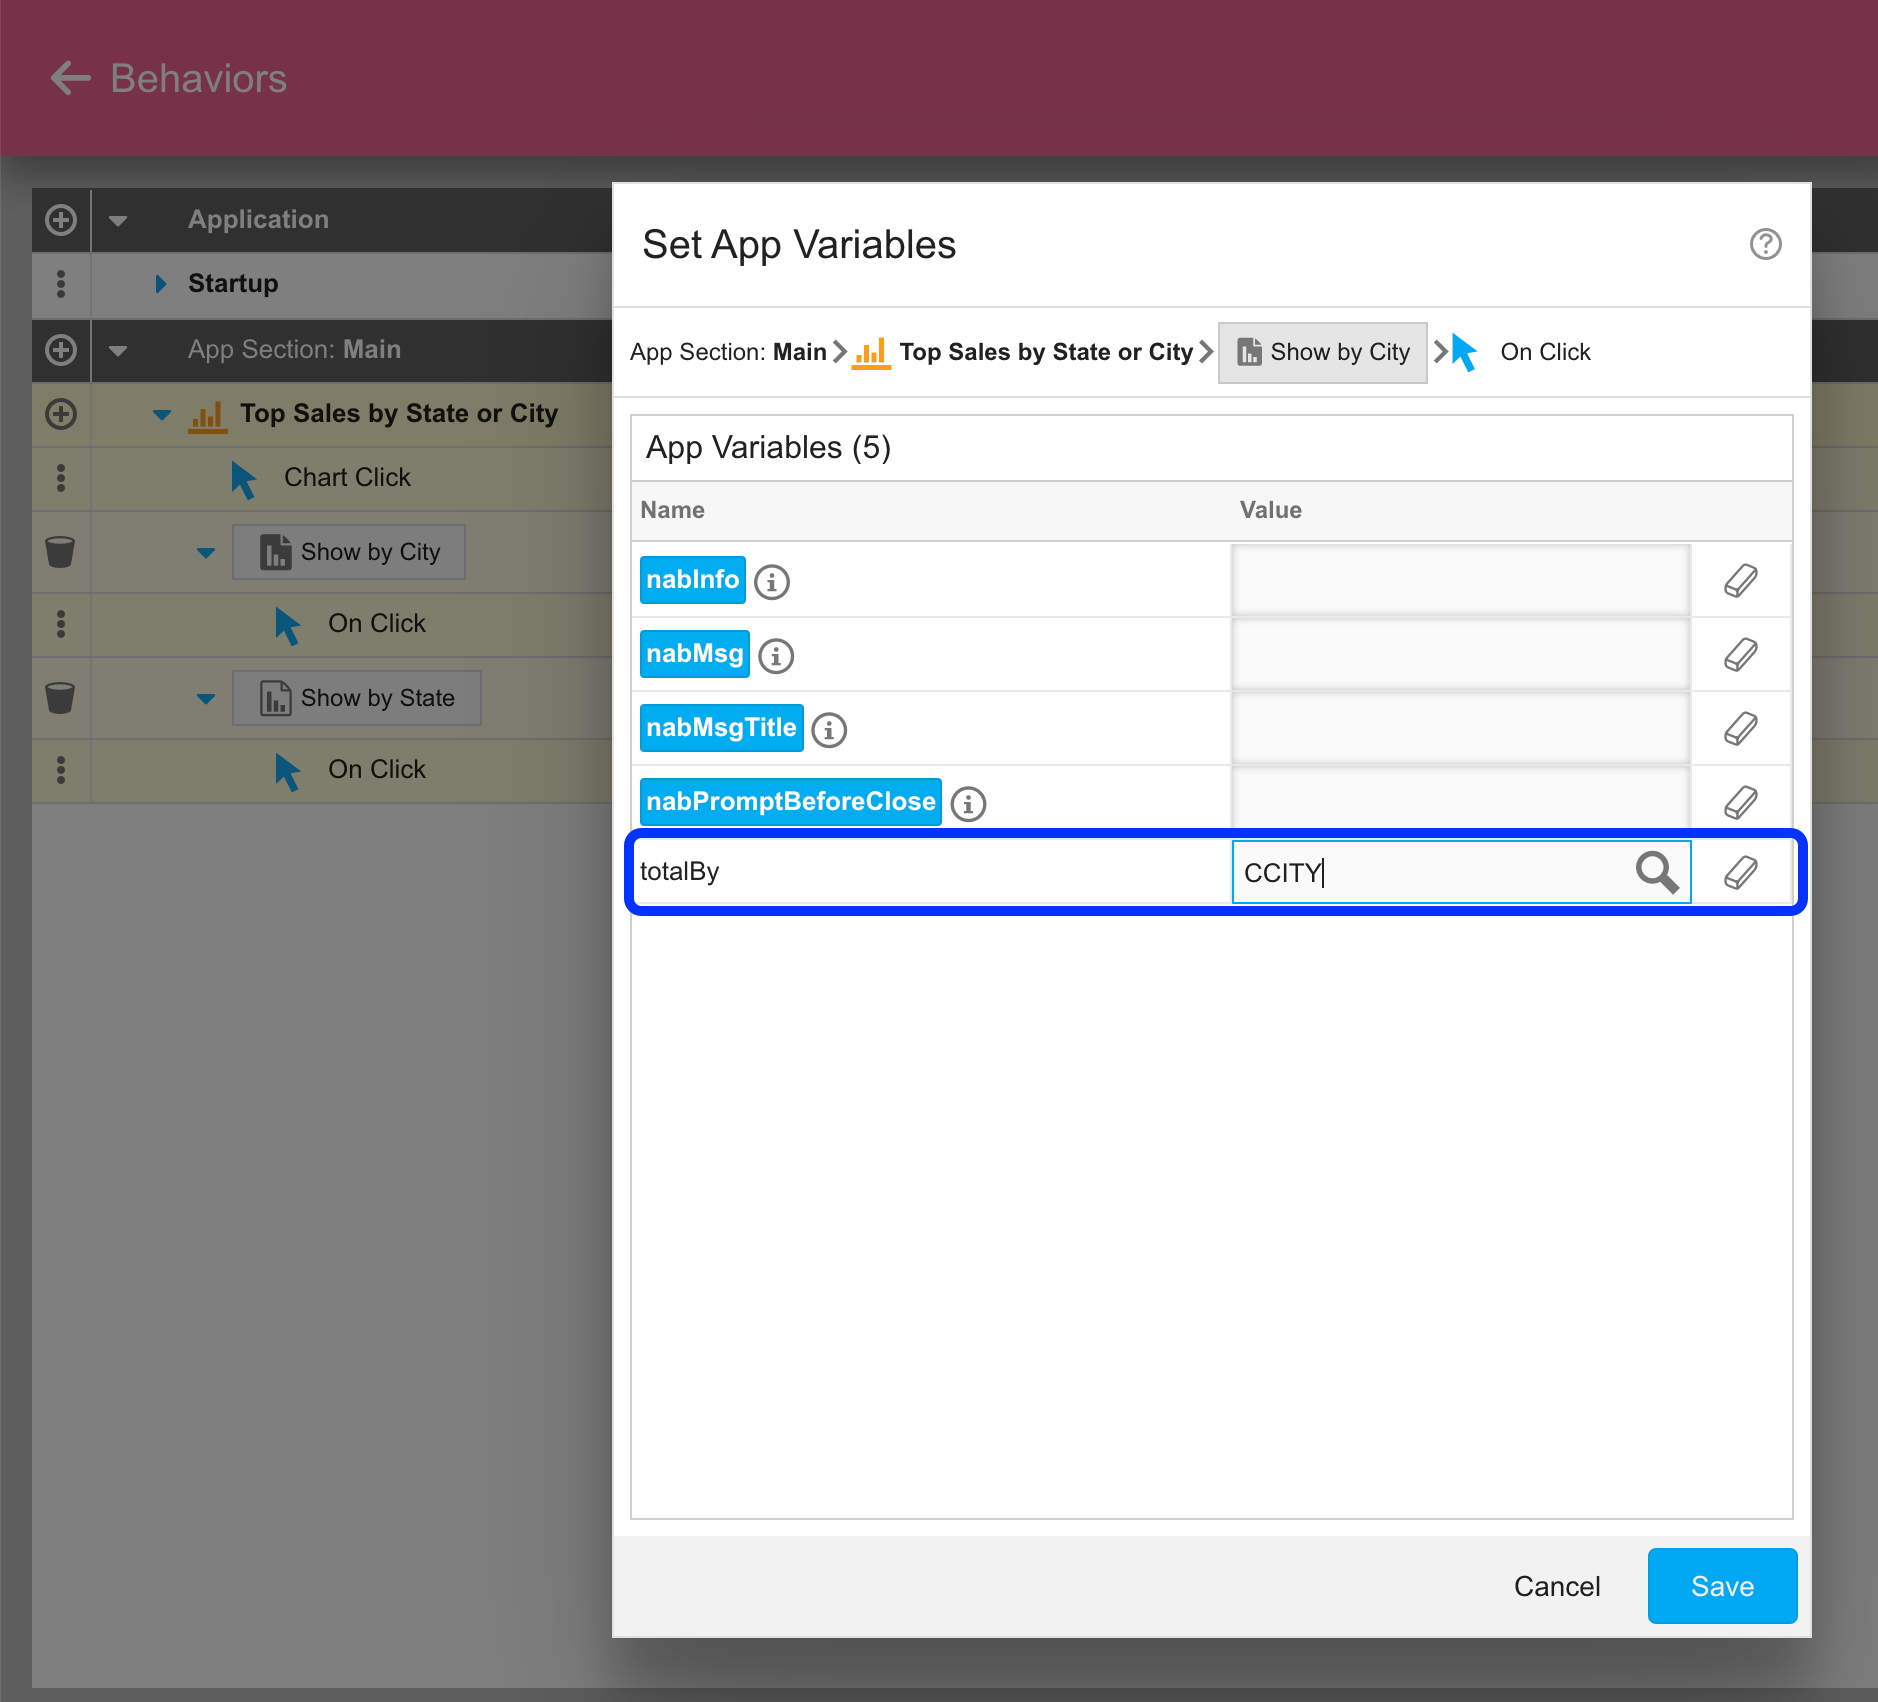
For the “Show by City” button’s “On Click” action, first select the Set App Variables menu option and have it set the “totalBy” App Variable to CCITY.
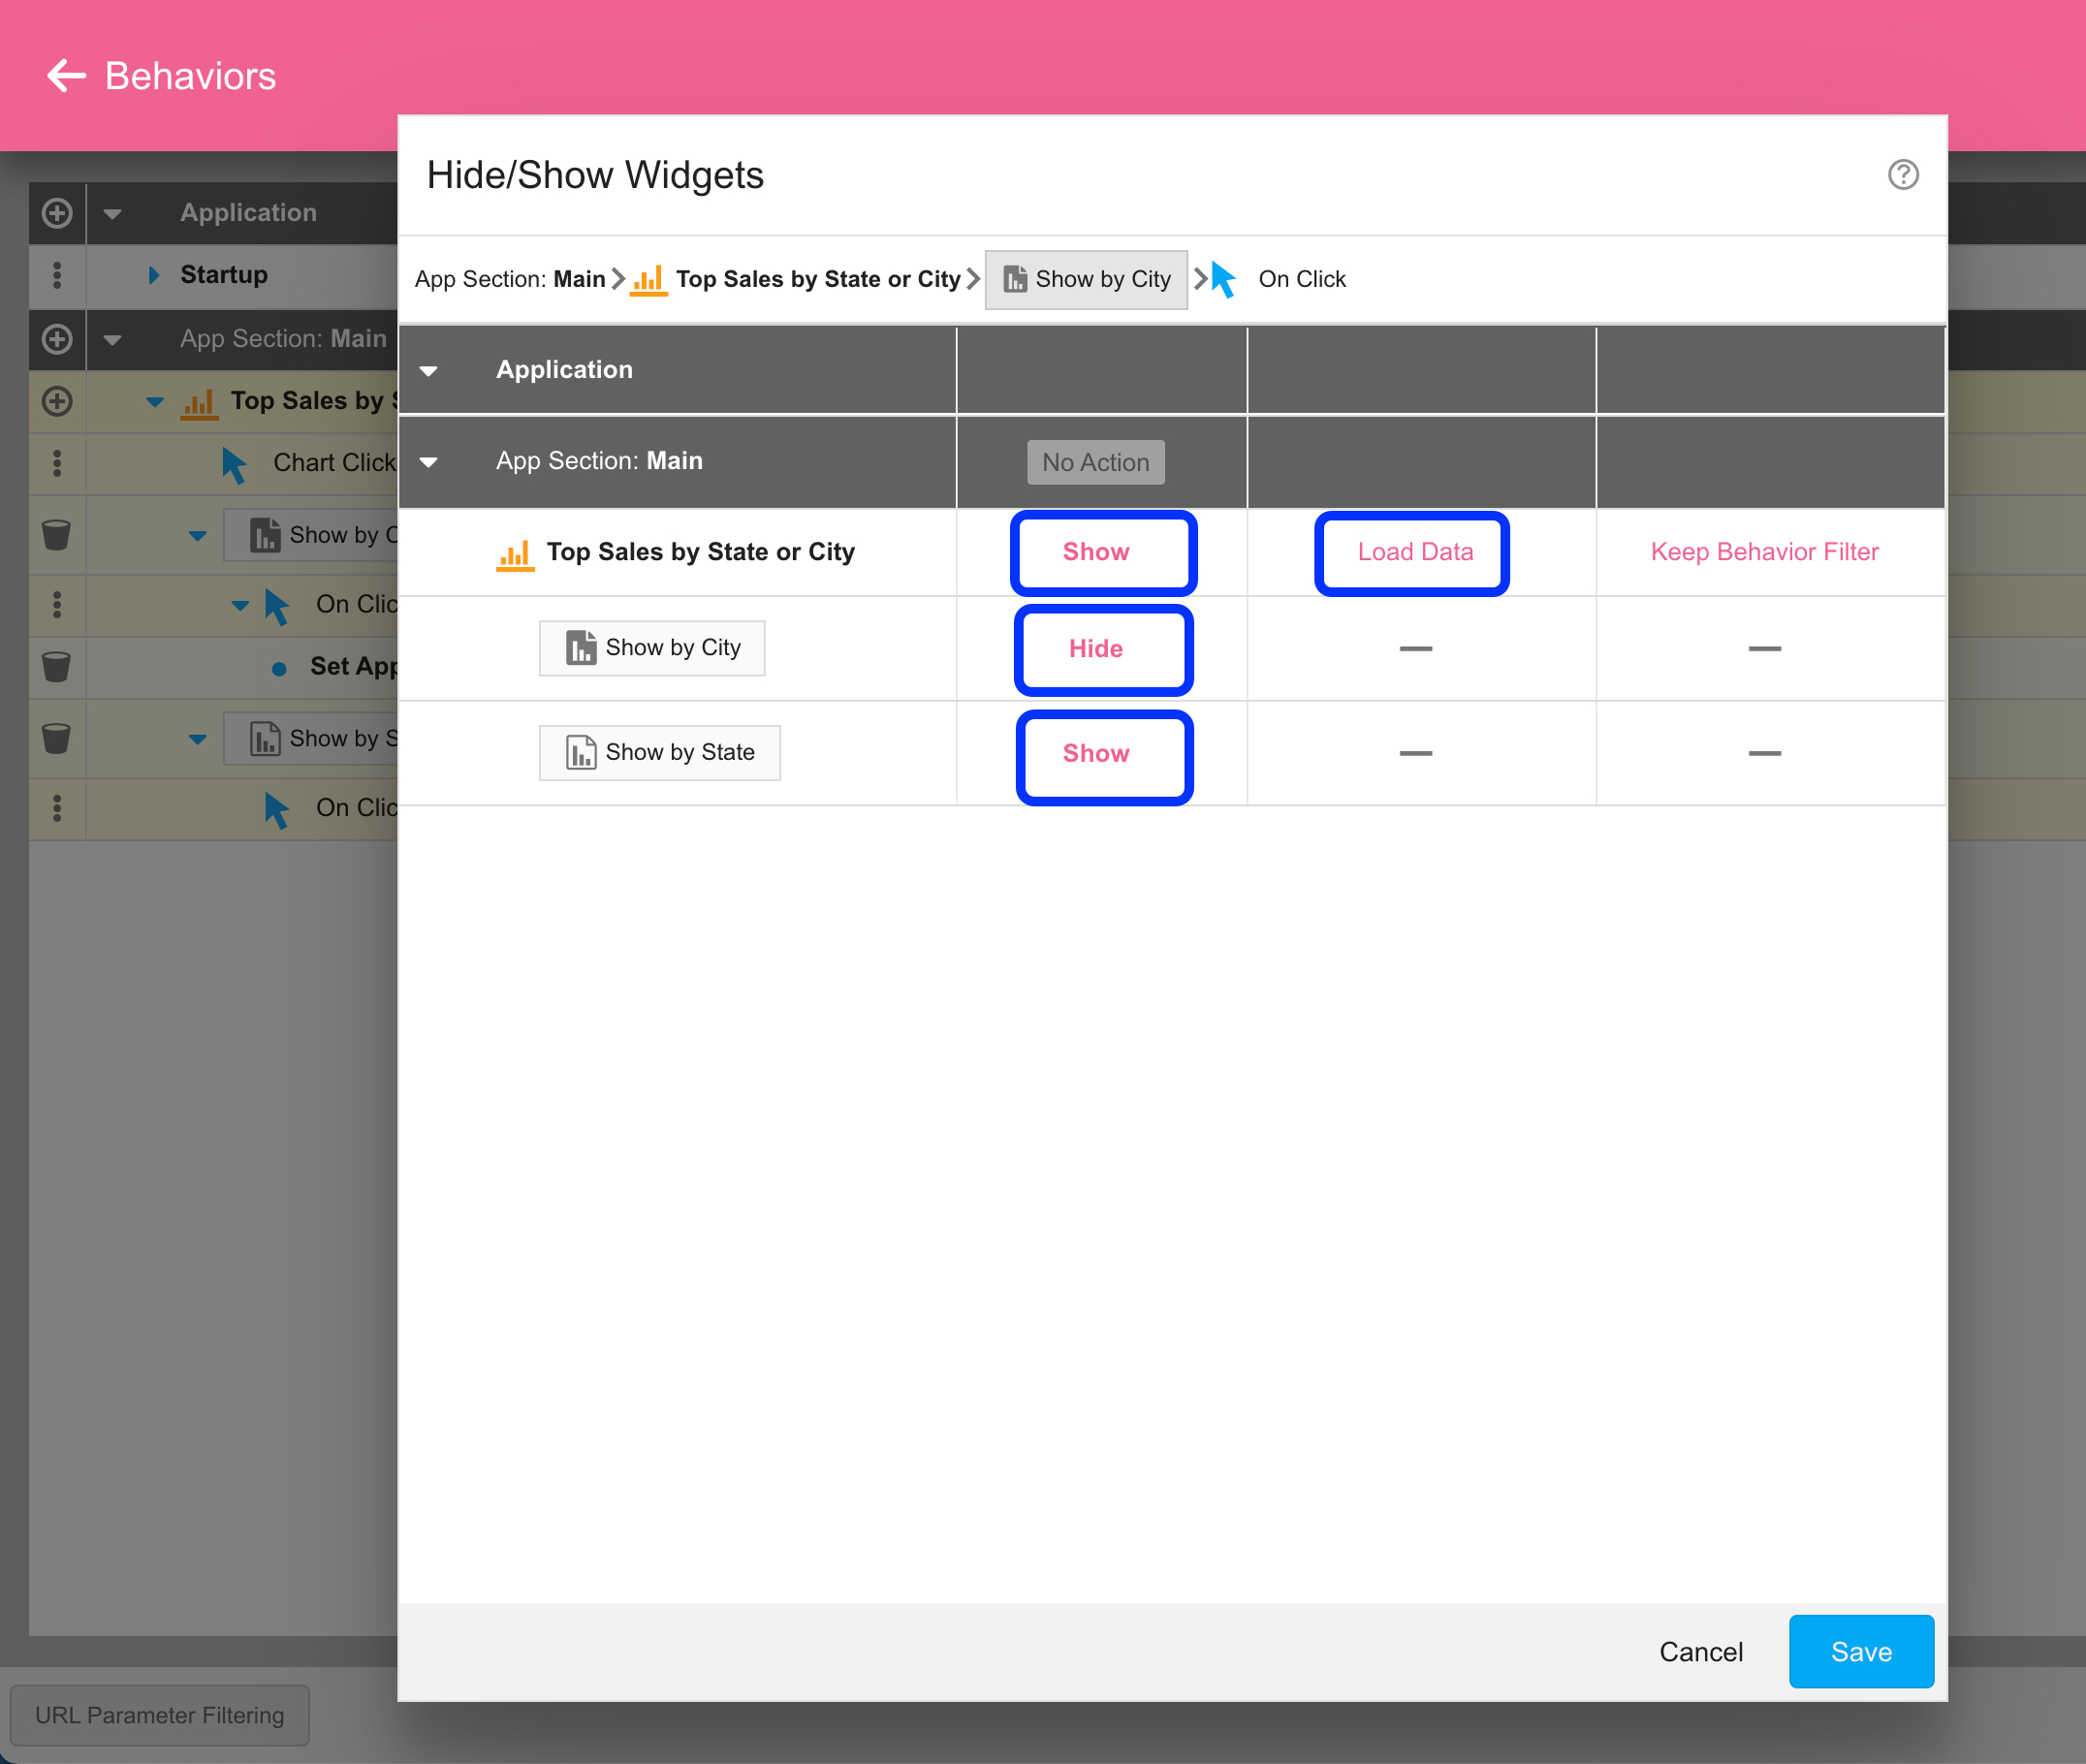
Click Save, then click again on the “On Click” action on the Hide/Show Widgets menu option and set it to do three things: (1) Show the chart widget and reload its data (which will apply our change to the App Variable), (2) Hide the “Show by City” button, and (3) Show the “Show by State” button. It should look like this after toggling each of the appropriate cells with a mouse click:
Now repeat that process for the “Show by State” button, except this time set the “totalBy” App Variable to CSTATE, show the “Show by City” button and hide the “Show by State” button.
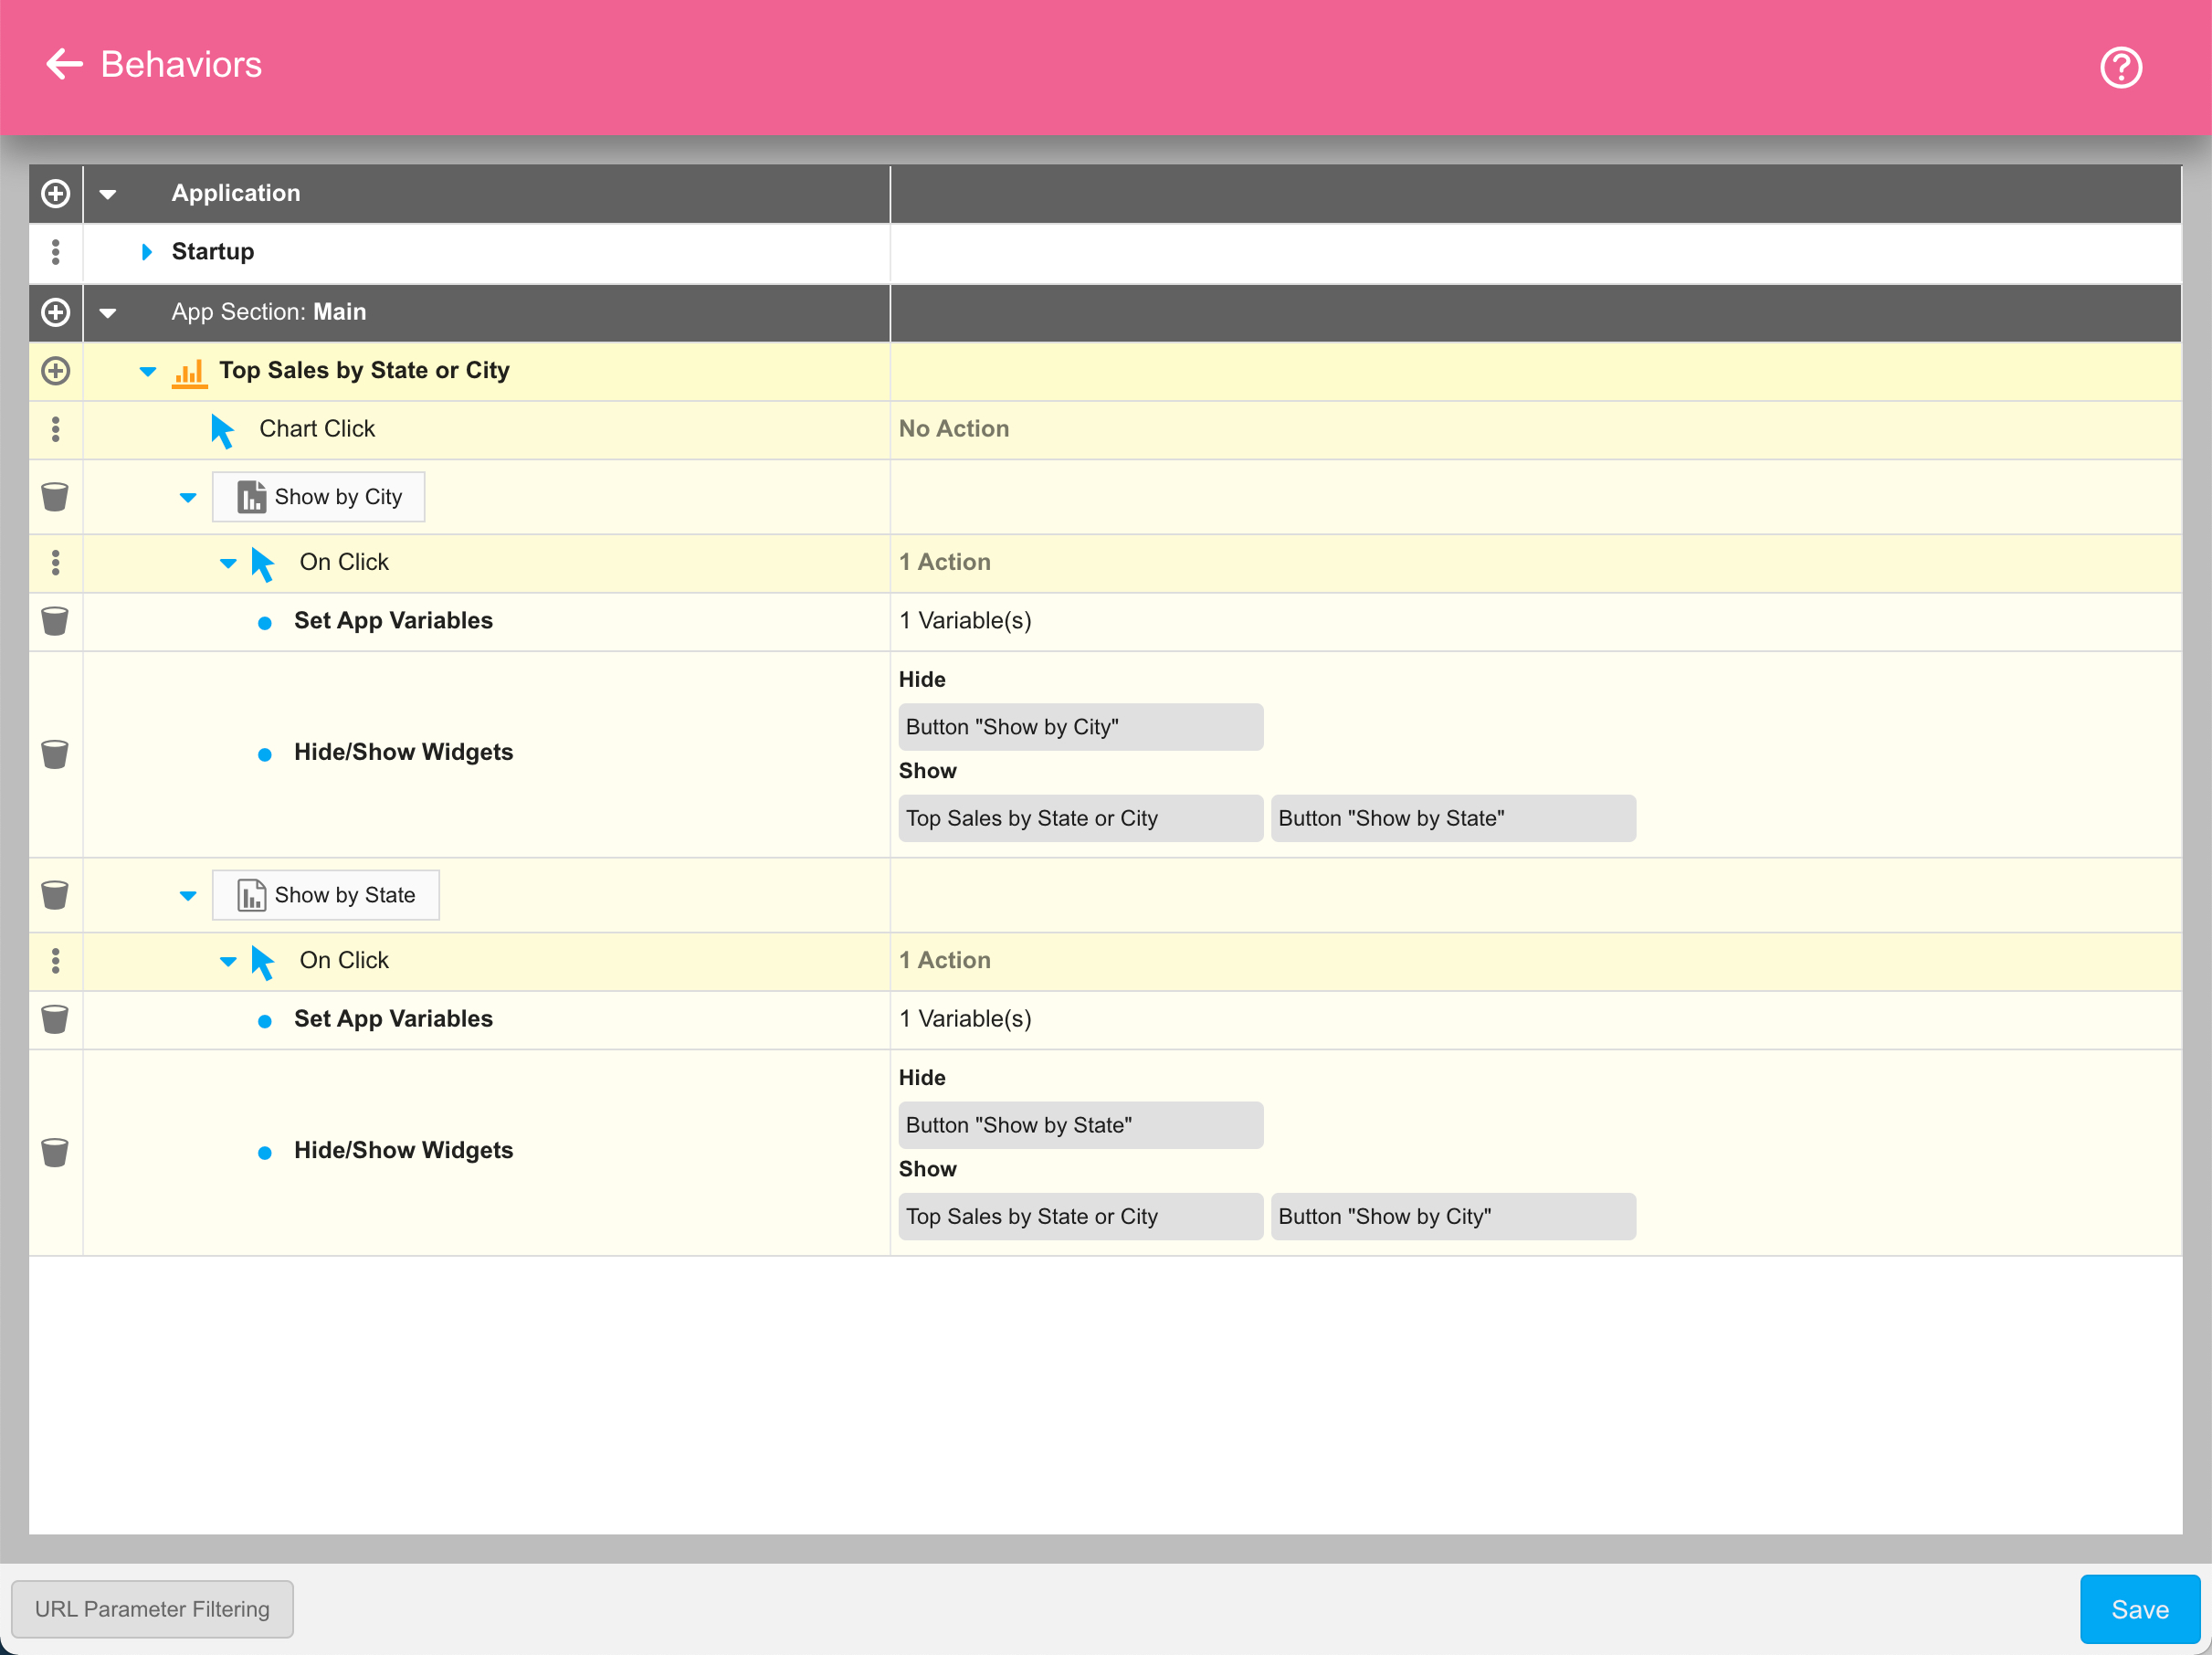
With those changes in place, your expanded behaviors list should look like this:
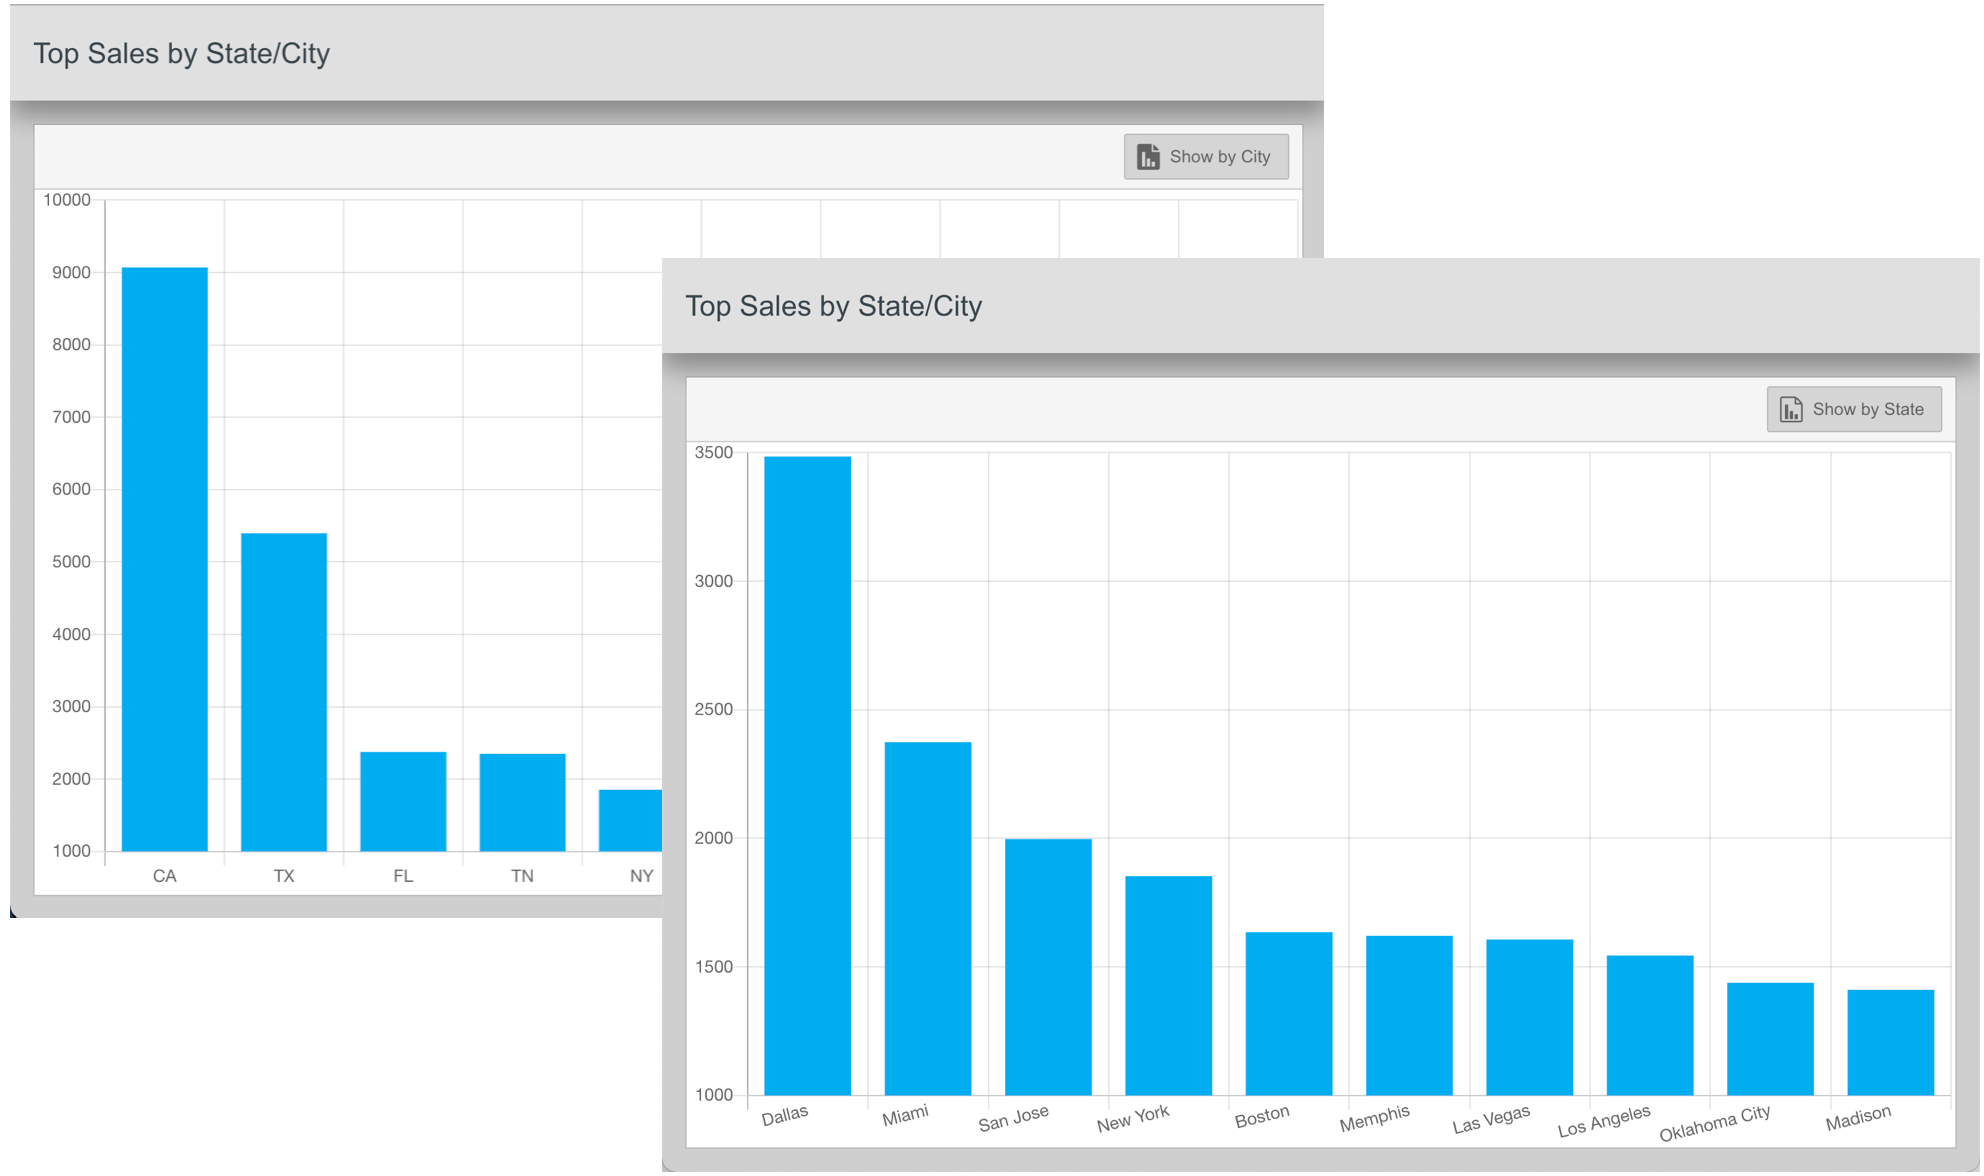
So save the Behaviors, save the App, then you can launch it and toggle your chart axis between “City” and “State” by clicking on the button. You could further refine the app by overriding the app title whenever a button is clicked, adding formatting to the dollars, etc…
This should give you a good feel for how you can allow controlled user manipulation of any part of your data sources using the vvIn_virtual function in conjunction with App Variables and Behaviors that adjust their values.