In today’s internet-connected society, just about any kind of information you need to know can be pulled into your system through a web service API. These APIs make it possible to pull public (or private) record sets into your Valence apps from databases that are not necessarily located within the walls of your company’s data center.

For instance, you could use the zip code of a customer address to pull in the current weather forecast for that location, which might be handy for anticipating delivery delays to that site, or determining the likelihood that the client you’re about to call left work early to hit the golf course.
Recent attendees of our Nitro App Builder on-line training sessions were introduced to this concept in one of the hands-on exercises, where we built out a Valence app to show users information on various popular cryptocurrencies. In this month’s tip, we’ll use one small piece of that app to demonstrate the concept of using SQL in a NAB data source to consume information from a RESTful web service, resulting in a historical chart of daily Bitcoin/Dogecoin/Etherium/etc. prices.
For this exercise we’ll be pulling data from one of the CoinGeckco cryptocurrency APIs that are available as a free service – no key required. The data will come back in JSON format, so we’ll be using two IBM i SQL functions: HTTPGETCLOB to pull in the API data, and JSON_TABLE to parse the JSON-formatted API response into useable columns we can link to a chart widget.
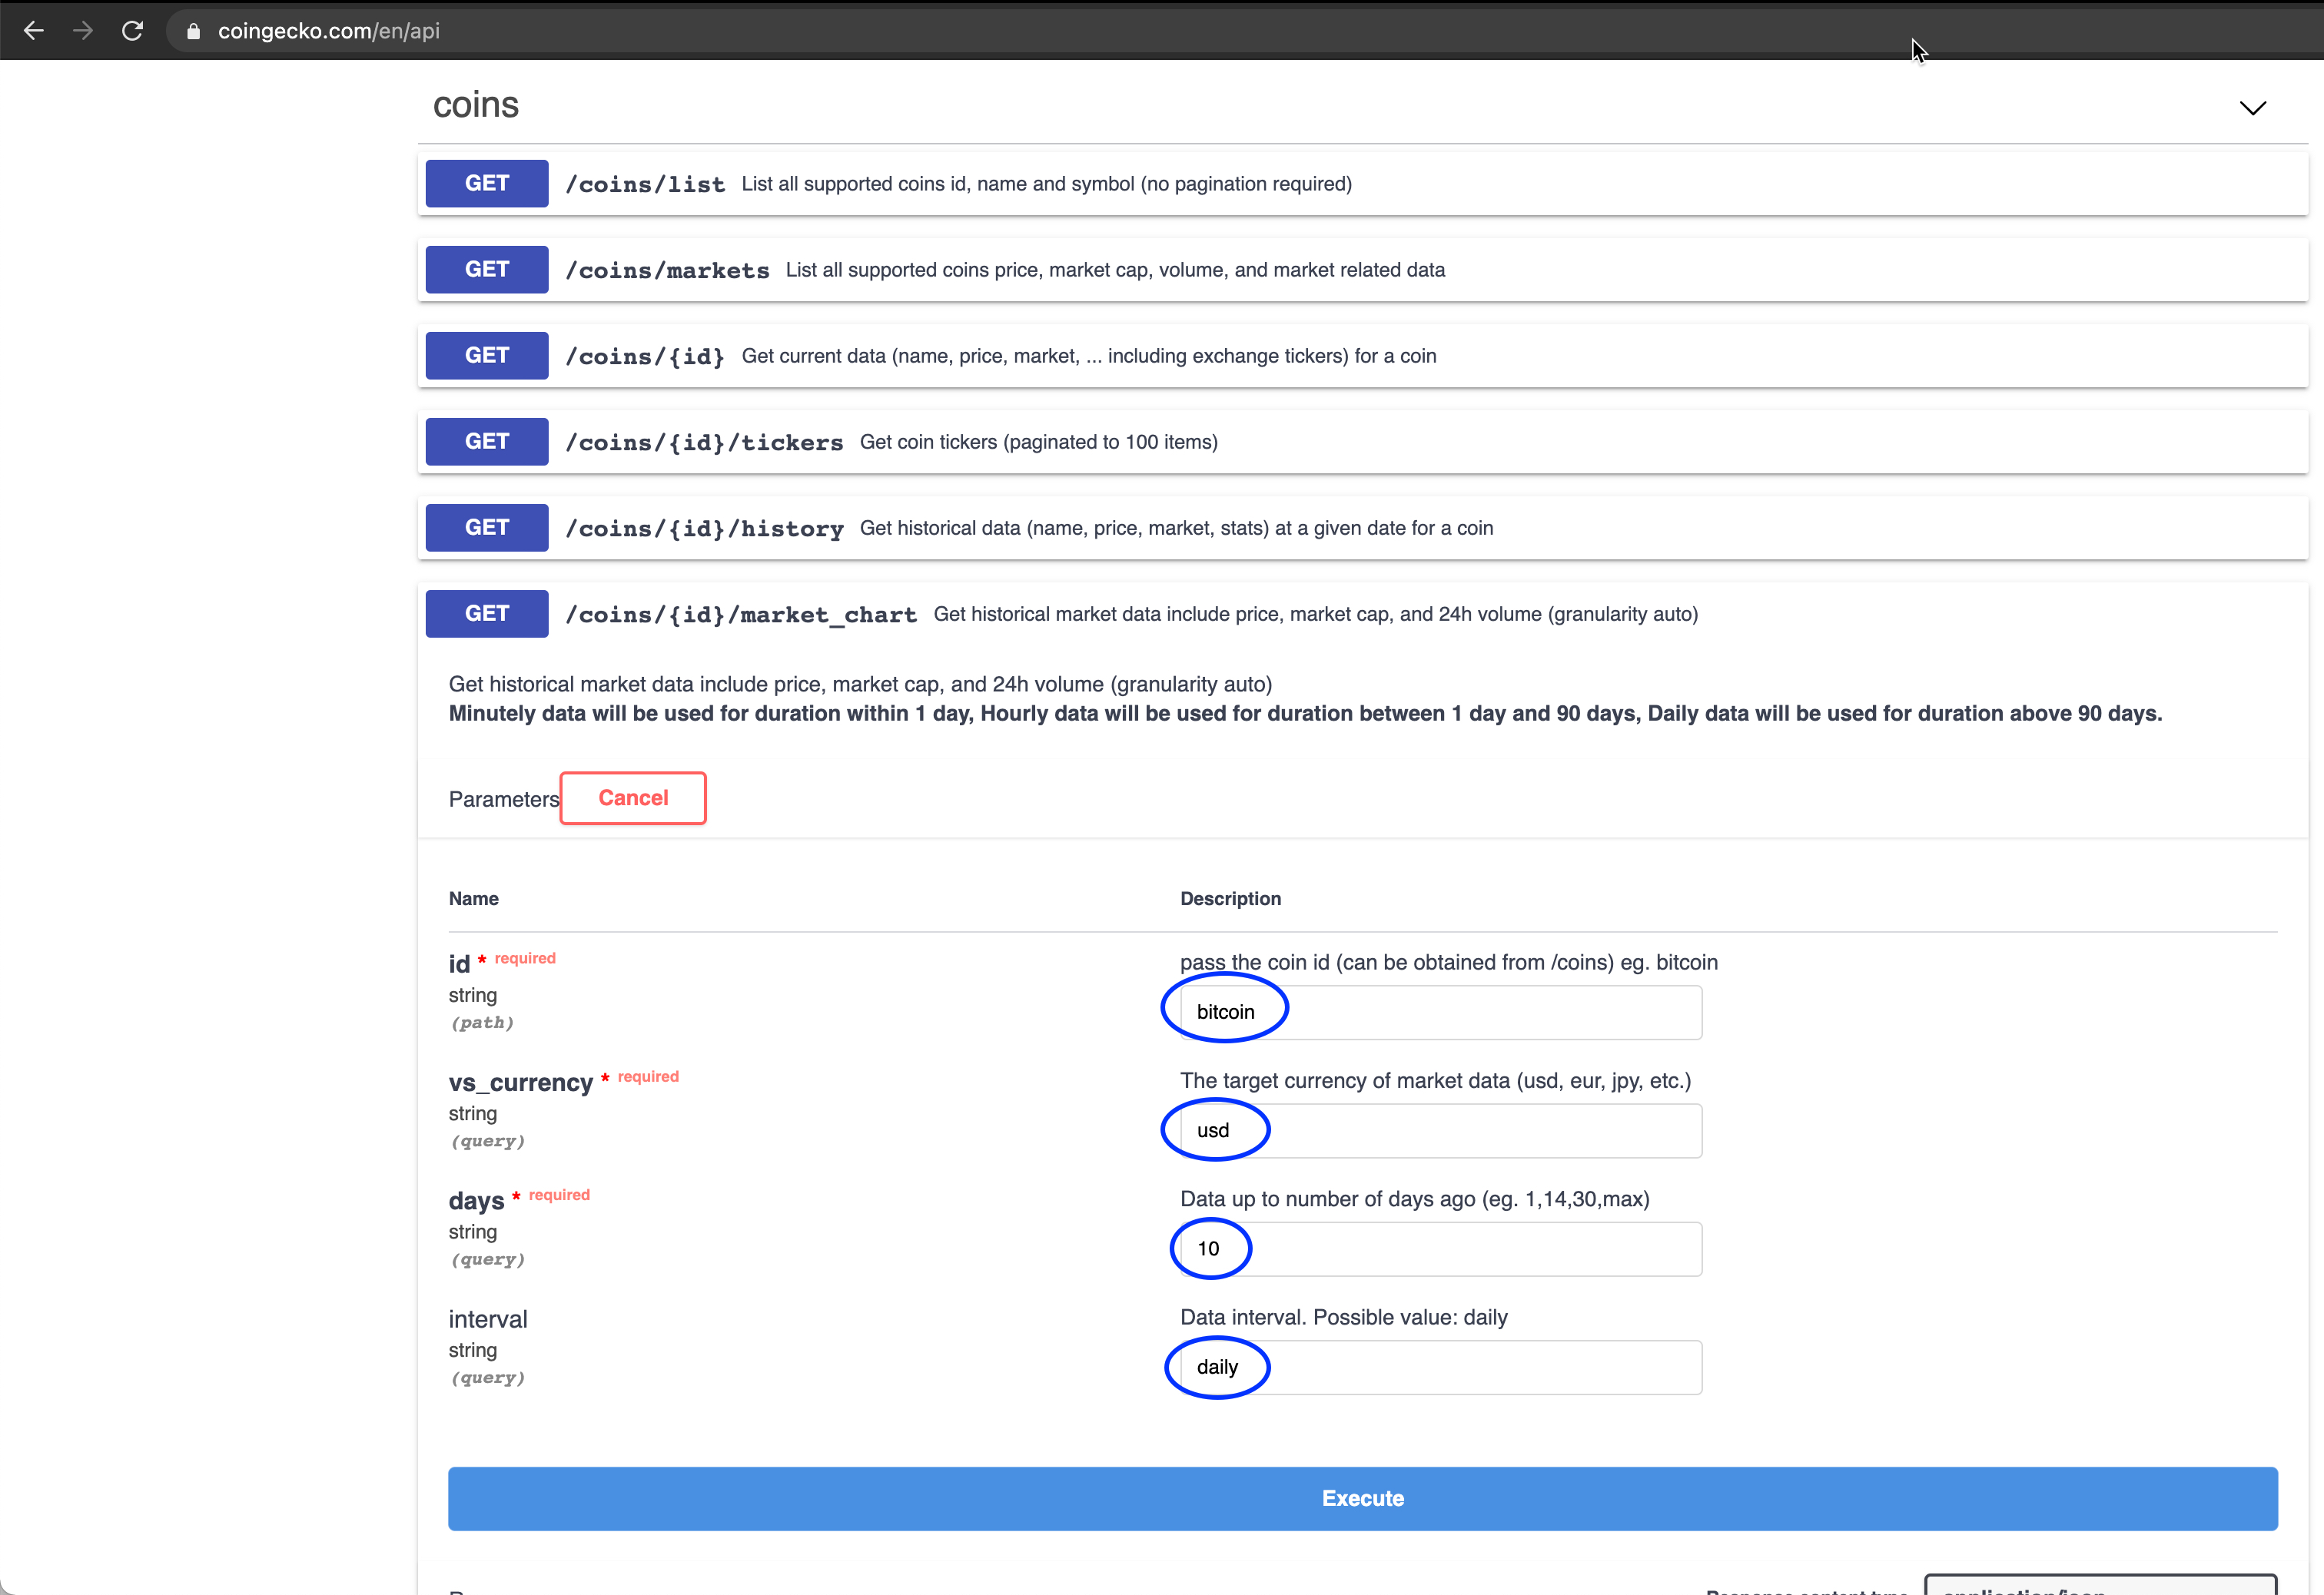
To illustrate what we can expect to receive, we’ll navigate to the API documentation for CoinGecko referenced above, where they have a handy tool for sampling the results of an API call to their system. We’re interested in retrieving a series of prices by date for a particular cryptocurrency, so we’ll scroll down to the market_chart API, click the “Try it out” button, fill in the query parameters to see what it returns:
After hitting Execute, the response comes back as follows:
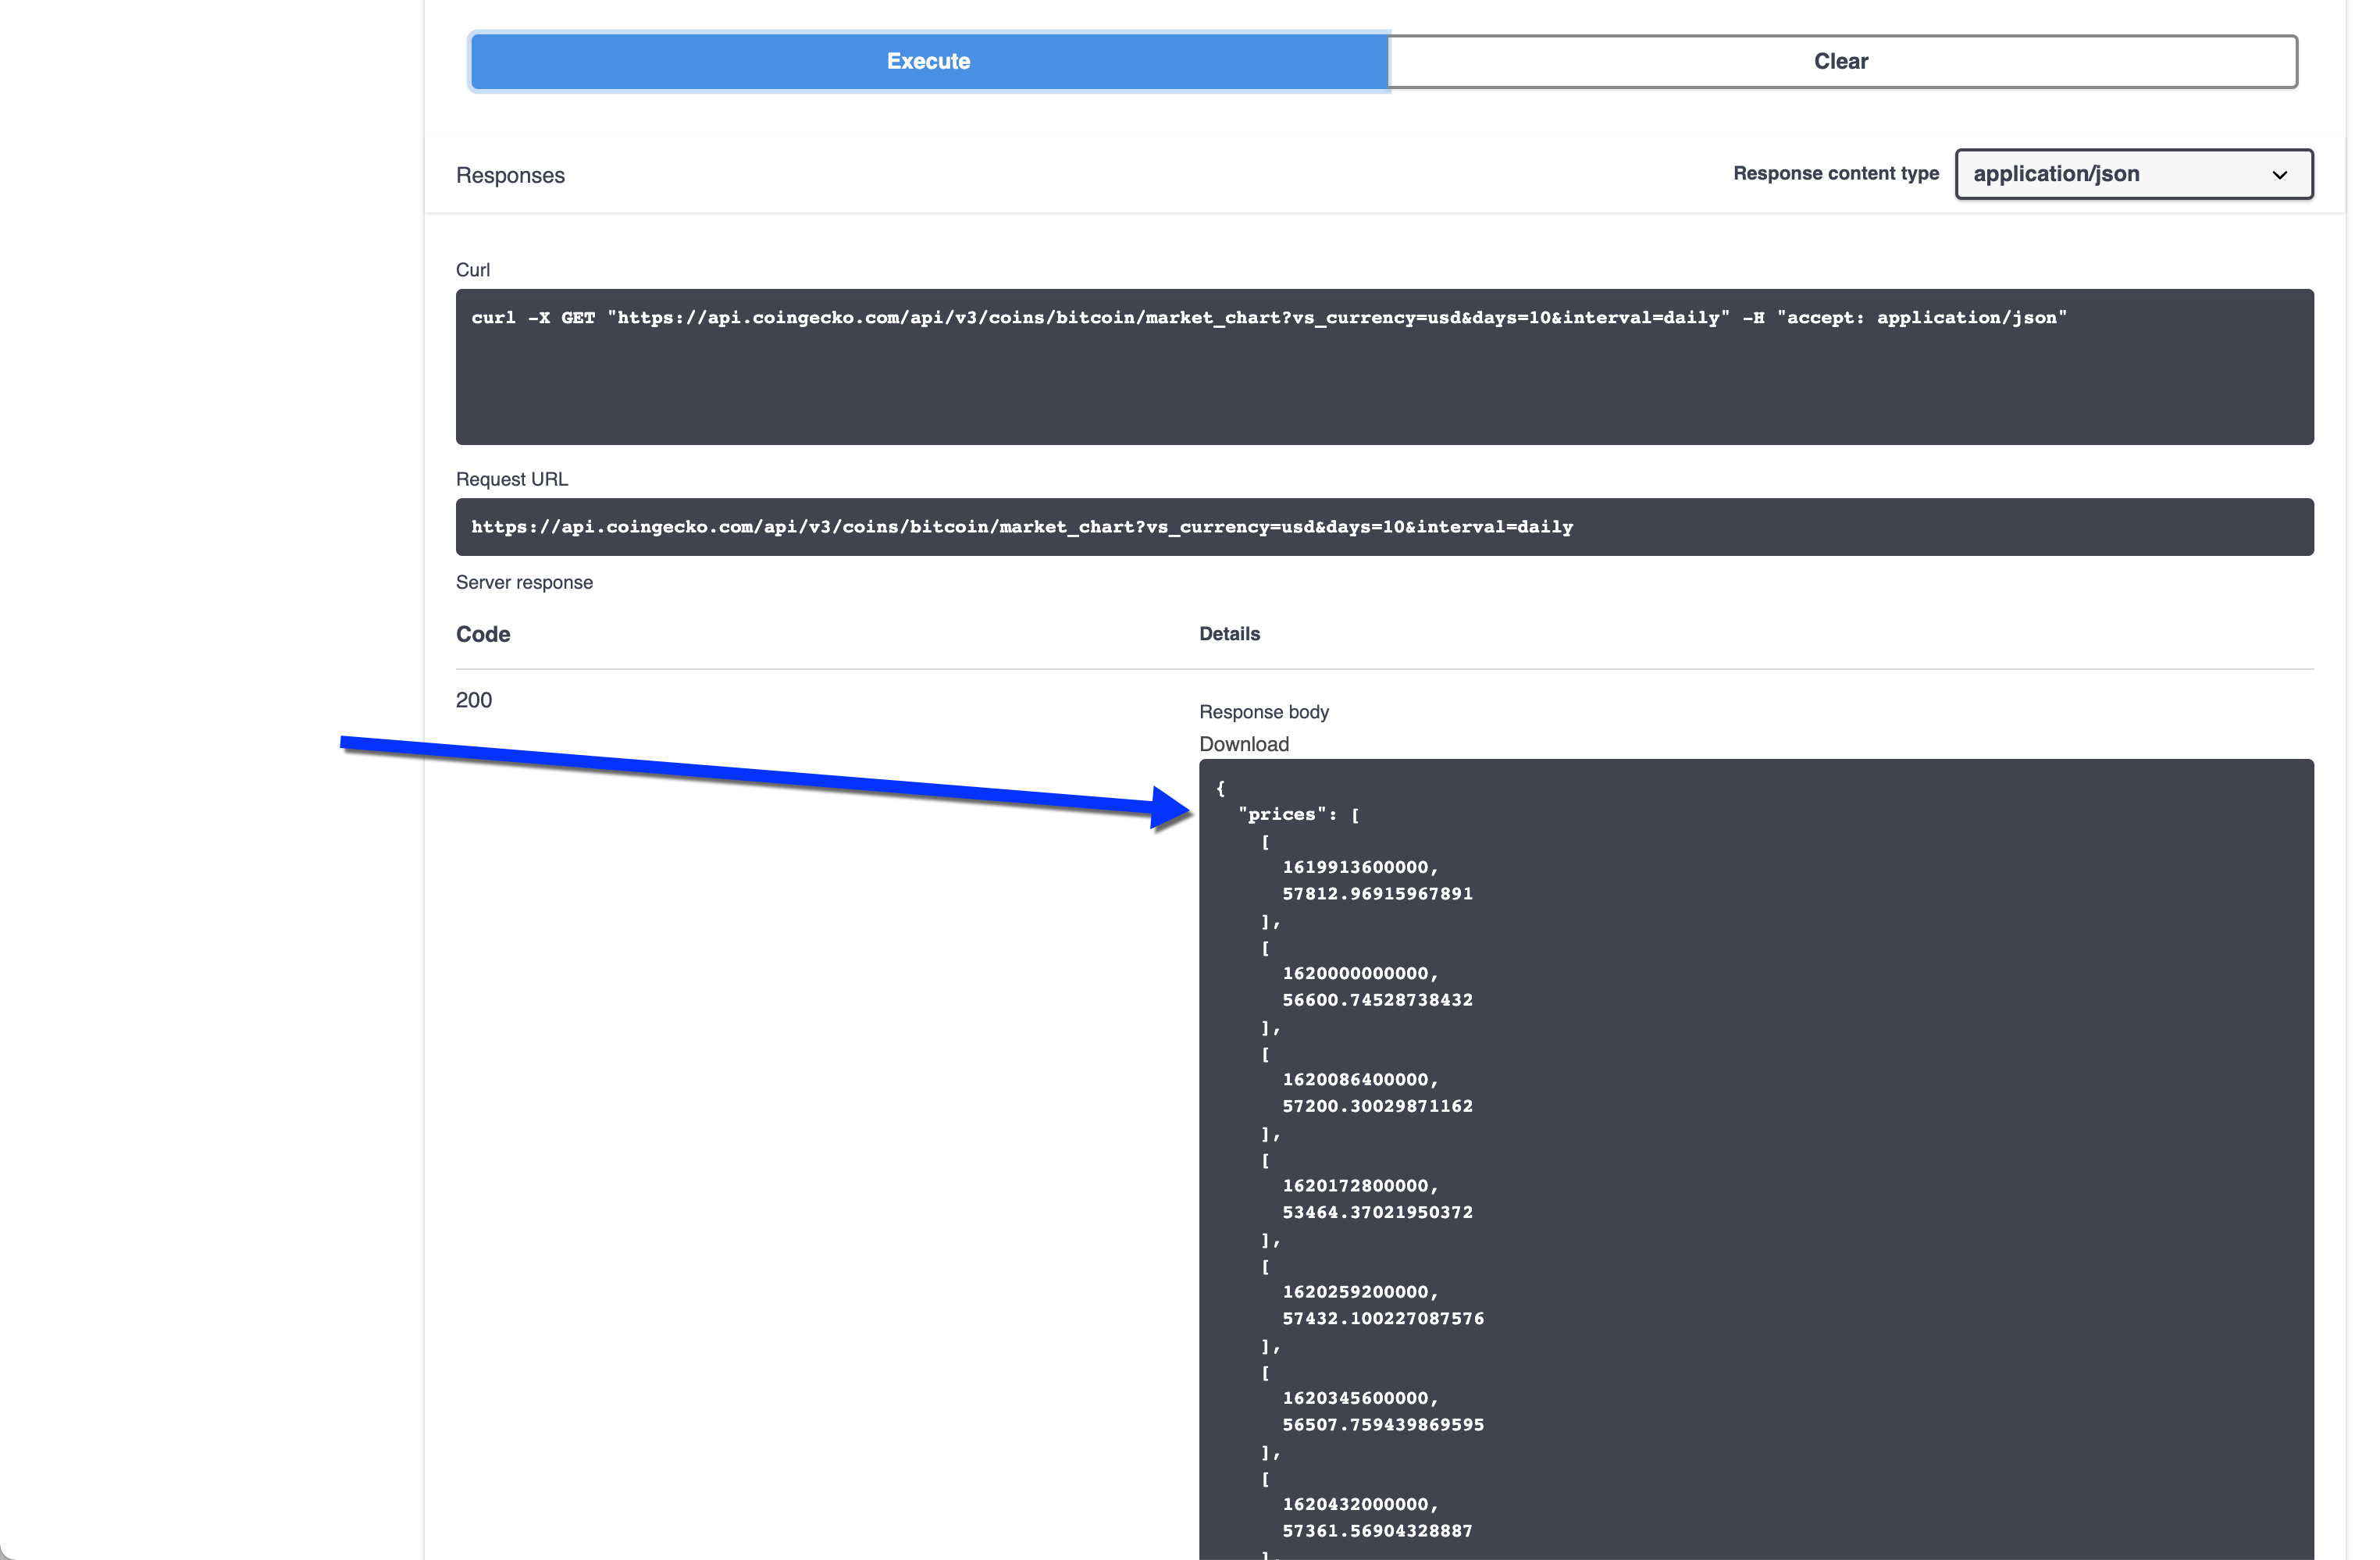
We’ll talk in more detail about how to make sense of the JSON response coming back from this API shortly. What’s important is that we now know what the API response will look like, so we can move on to the next step of defining a means to trigger this data to be generated and consume it.
To do this we’ll go into Nitro App Builder and create an SQL-based data source to access the web service. The SQL statement should look like this (explanation will follow):
 SELECT price,
        jsTstamp,
        date(timestamp('1970-01-01') +
            (jsTstamp/1000) seconds - 7 hours) as cDate
   FROM json_table(
           systools.httpgetclob(
                'https://api.coingecko.com/api/v3'
                   ||'/coins/bitcoin/market_chart'
                   ||'?vs_currency=usd&days=10&interval=daily',
                null),
           '$.prices'
           columns(
                jsTstamp decimal(13,0) path '$ [0]',
                price    decimal(11,2) path '$ [1]'
           )
        )
  ORDER BY cdate
Let’s dissect what’s going on here, starting at the innermost part of the SQL statement and working our way out…
First we have the HTTPGETCLOB call, which is reaching out to the appropriate CoinGecko API to get back a list of 10 days worth of Bitcoin prices. The first parameter passed into HTTPGETCLOB is the URL for the API (concatenated via “||” on three separate lines here for better readability). The URL includes the query parameters we tinkered with above on their website: relative currency (usd), the number of days to go back (10) and the interval (daily). The second parameter of HTTPGETCLOB is for passing header data, which is not applicable to this API, but since the parameter is required on the function we’re passing null.
The response to the HTTPGETCLOB call here is serving as the first parameter for the JSON_TABLE function. The second parameter is an expression that will be used to parse the JSON response into just what we need. It begins with this string: ‘$.prices’. The “$” here is a reference to the JSON object, and “.prices” indicates we’re looking for an array called prices. This is followed by a column definitions list, where telling it to pull the first and second array elements and name them “jsTstamp” and “price” (remember arrays in JSON always start at 0 — hence [0] and [1], not [1] and [2] are used here).
Finally we have our main SELECT statement to formally pull the columns for our data source. The first two columns, price and jsTstamp, are coming straight out of the json_table response that is parsing out the JSON data as needed. The third column is a calculation that converts jsTstamp into a standard *ISO timestamp and extracts its date. In JavaScript/JSON, timestamps are typically expressed in something similar to Unix Epoch time, which is essentially the number of milliseconds elapsed since midnight on 1 January, 1970. So in this calculation we’re taking that 13-digit timestamp value, dividing it by 1000 to convert it from milliseconds to seconds, then adding it to the “root” date of 1970-01-01. That gets us to GMT, so in our case we’re subtracting 7 hours to get to the local time here in Chicago.
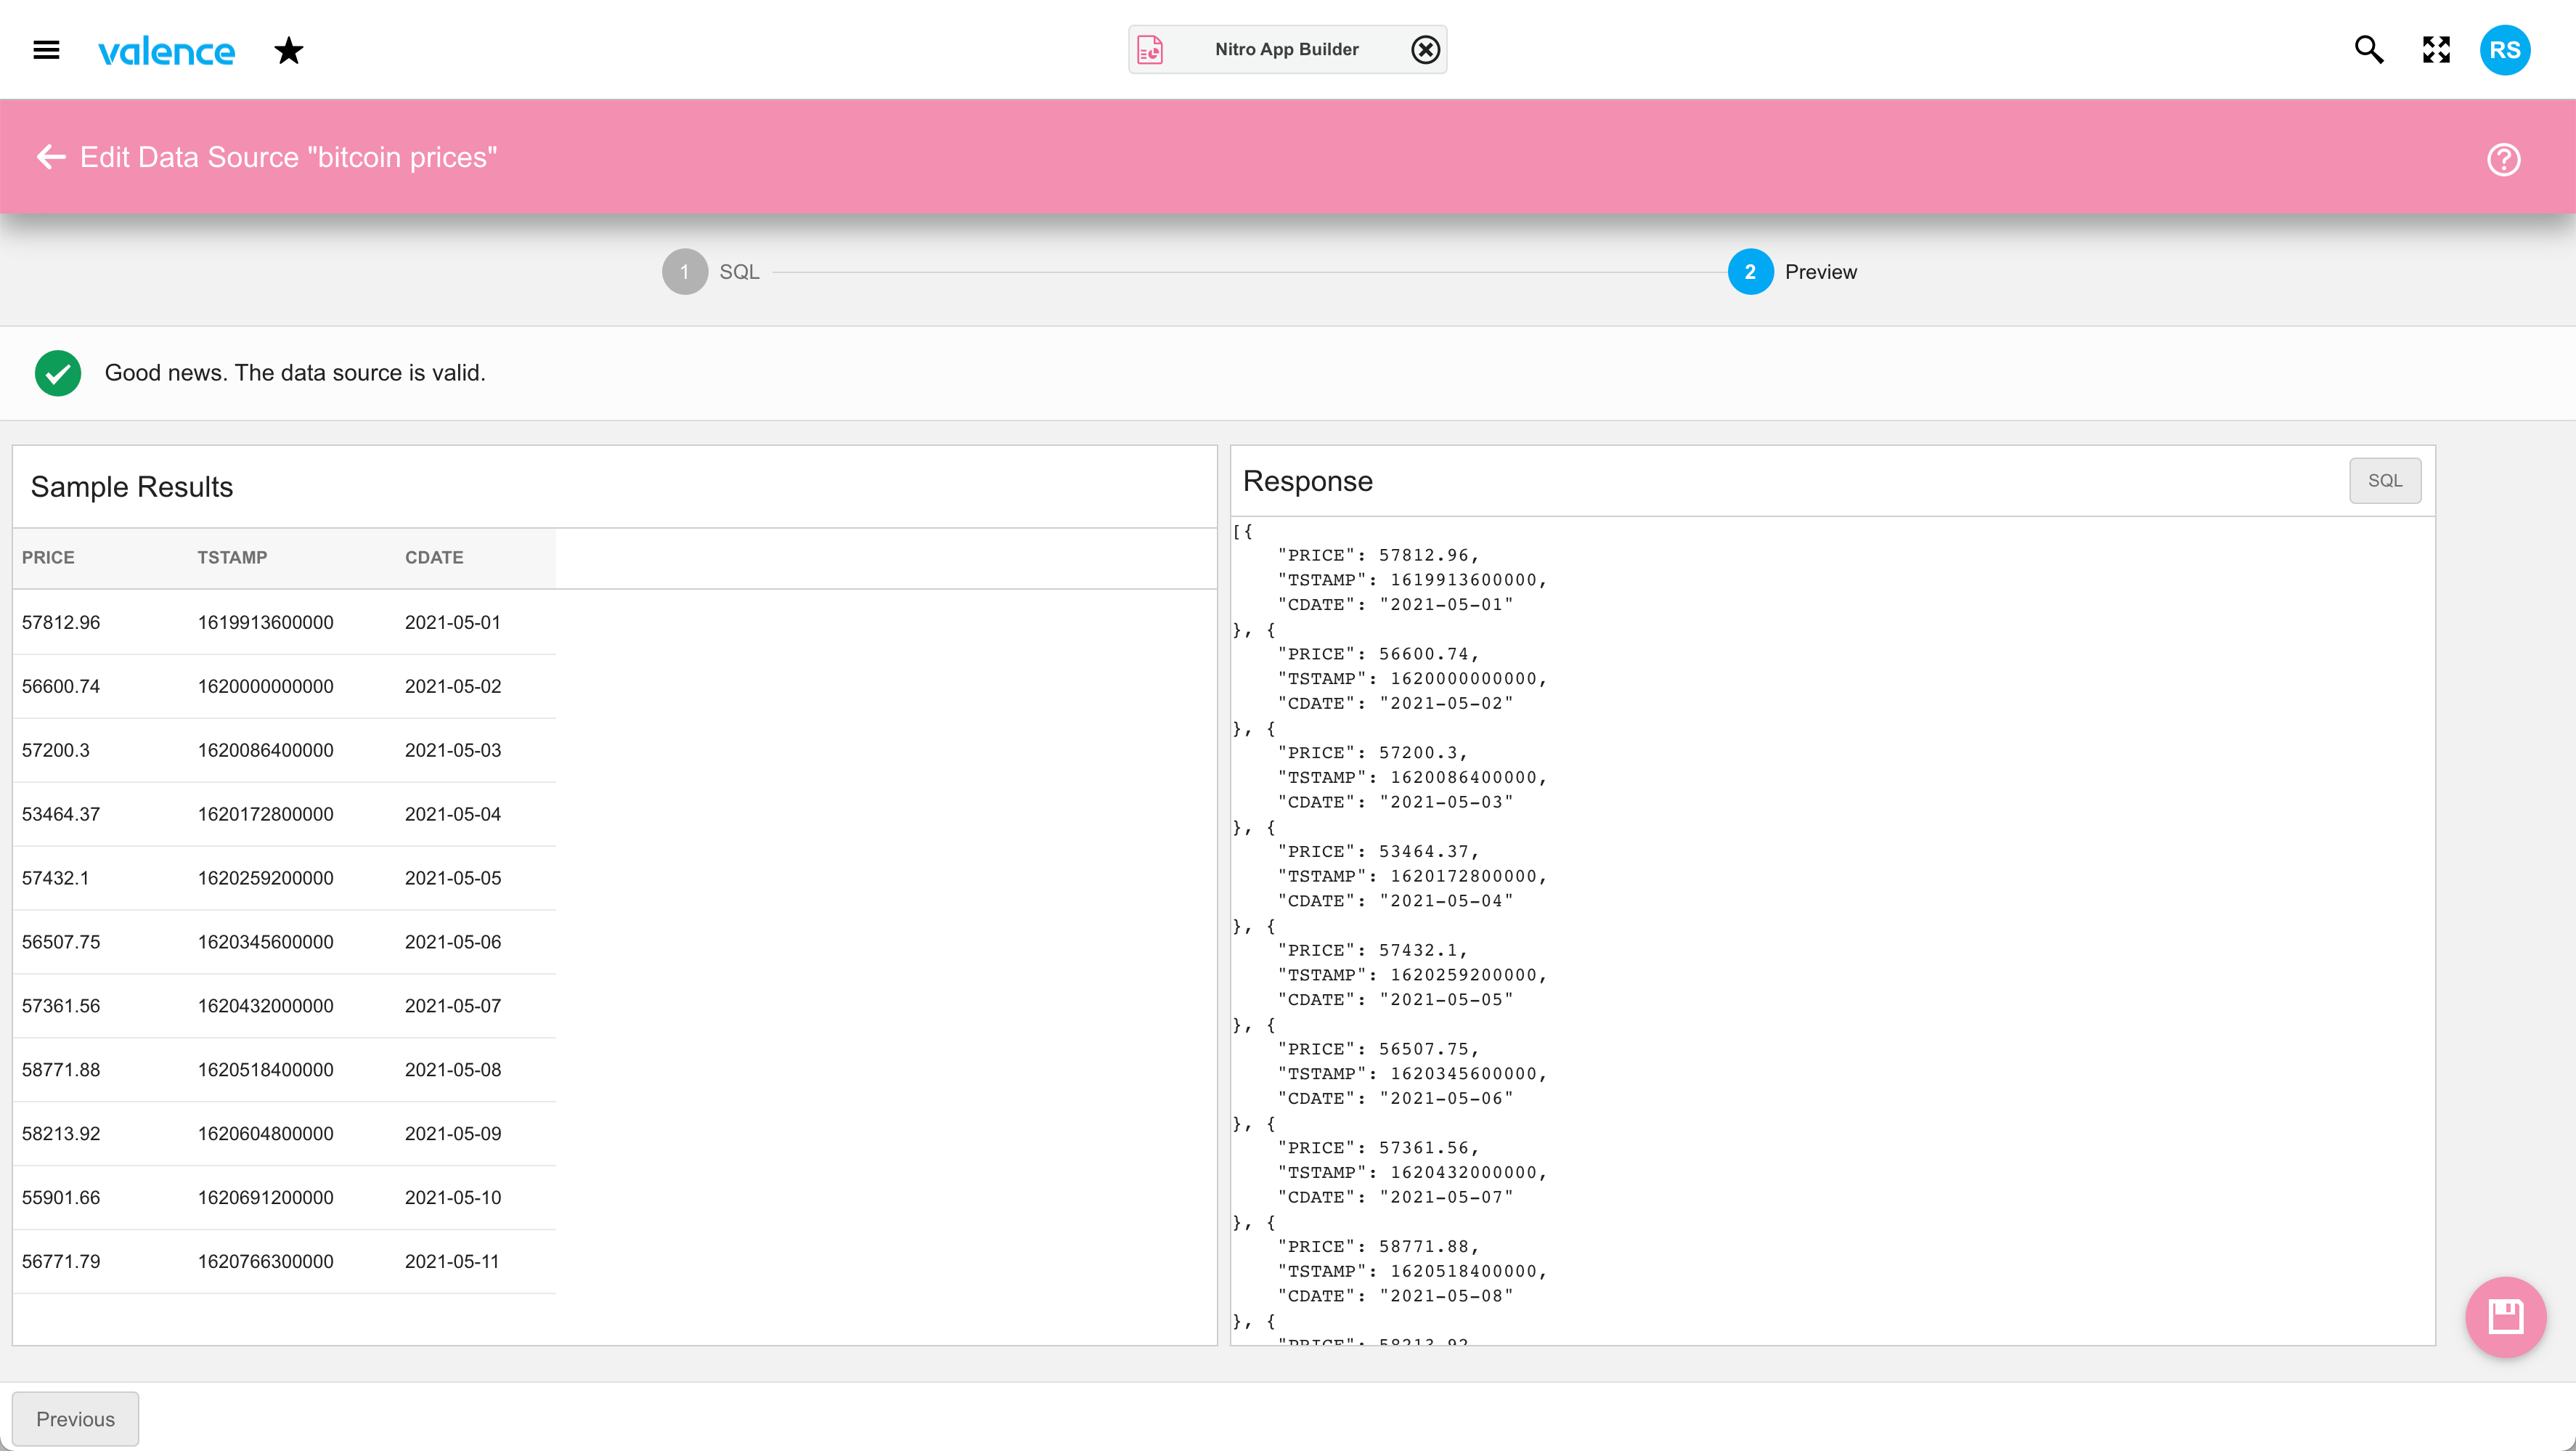
The resulting preview of the data source shows we’re getting price and date info we can work with…
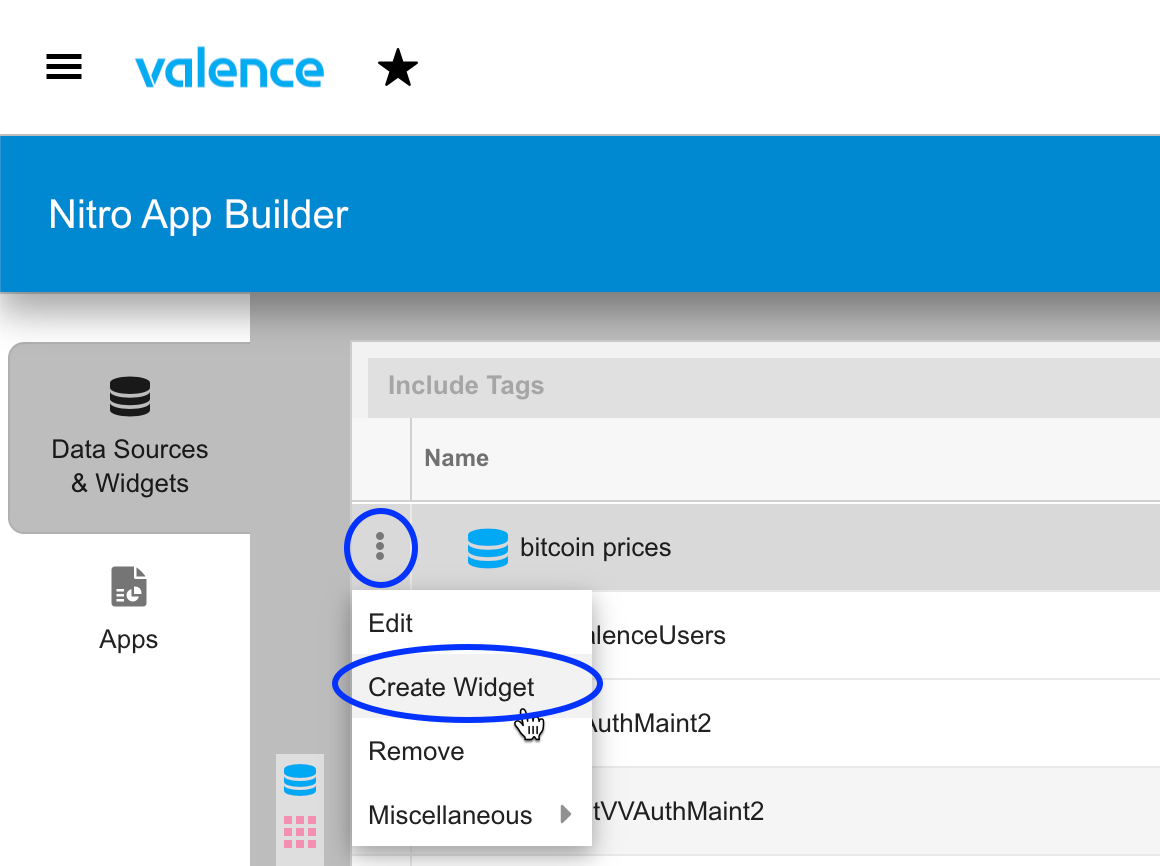
Once the data source is saved, we can proceed to create a standard line chart widget and place it into an app. So click on the three dots left of the newly created data source and select Create Widget…
Pick the Line Chart widget and configure it to use PRICE for the data value (y axis) and CDATE as the label value (x axis). You can further refine it to format the date and price via the “UI” section, as was done here…
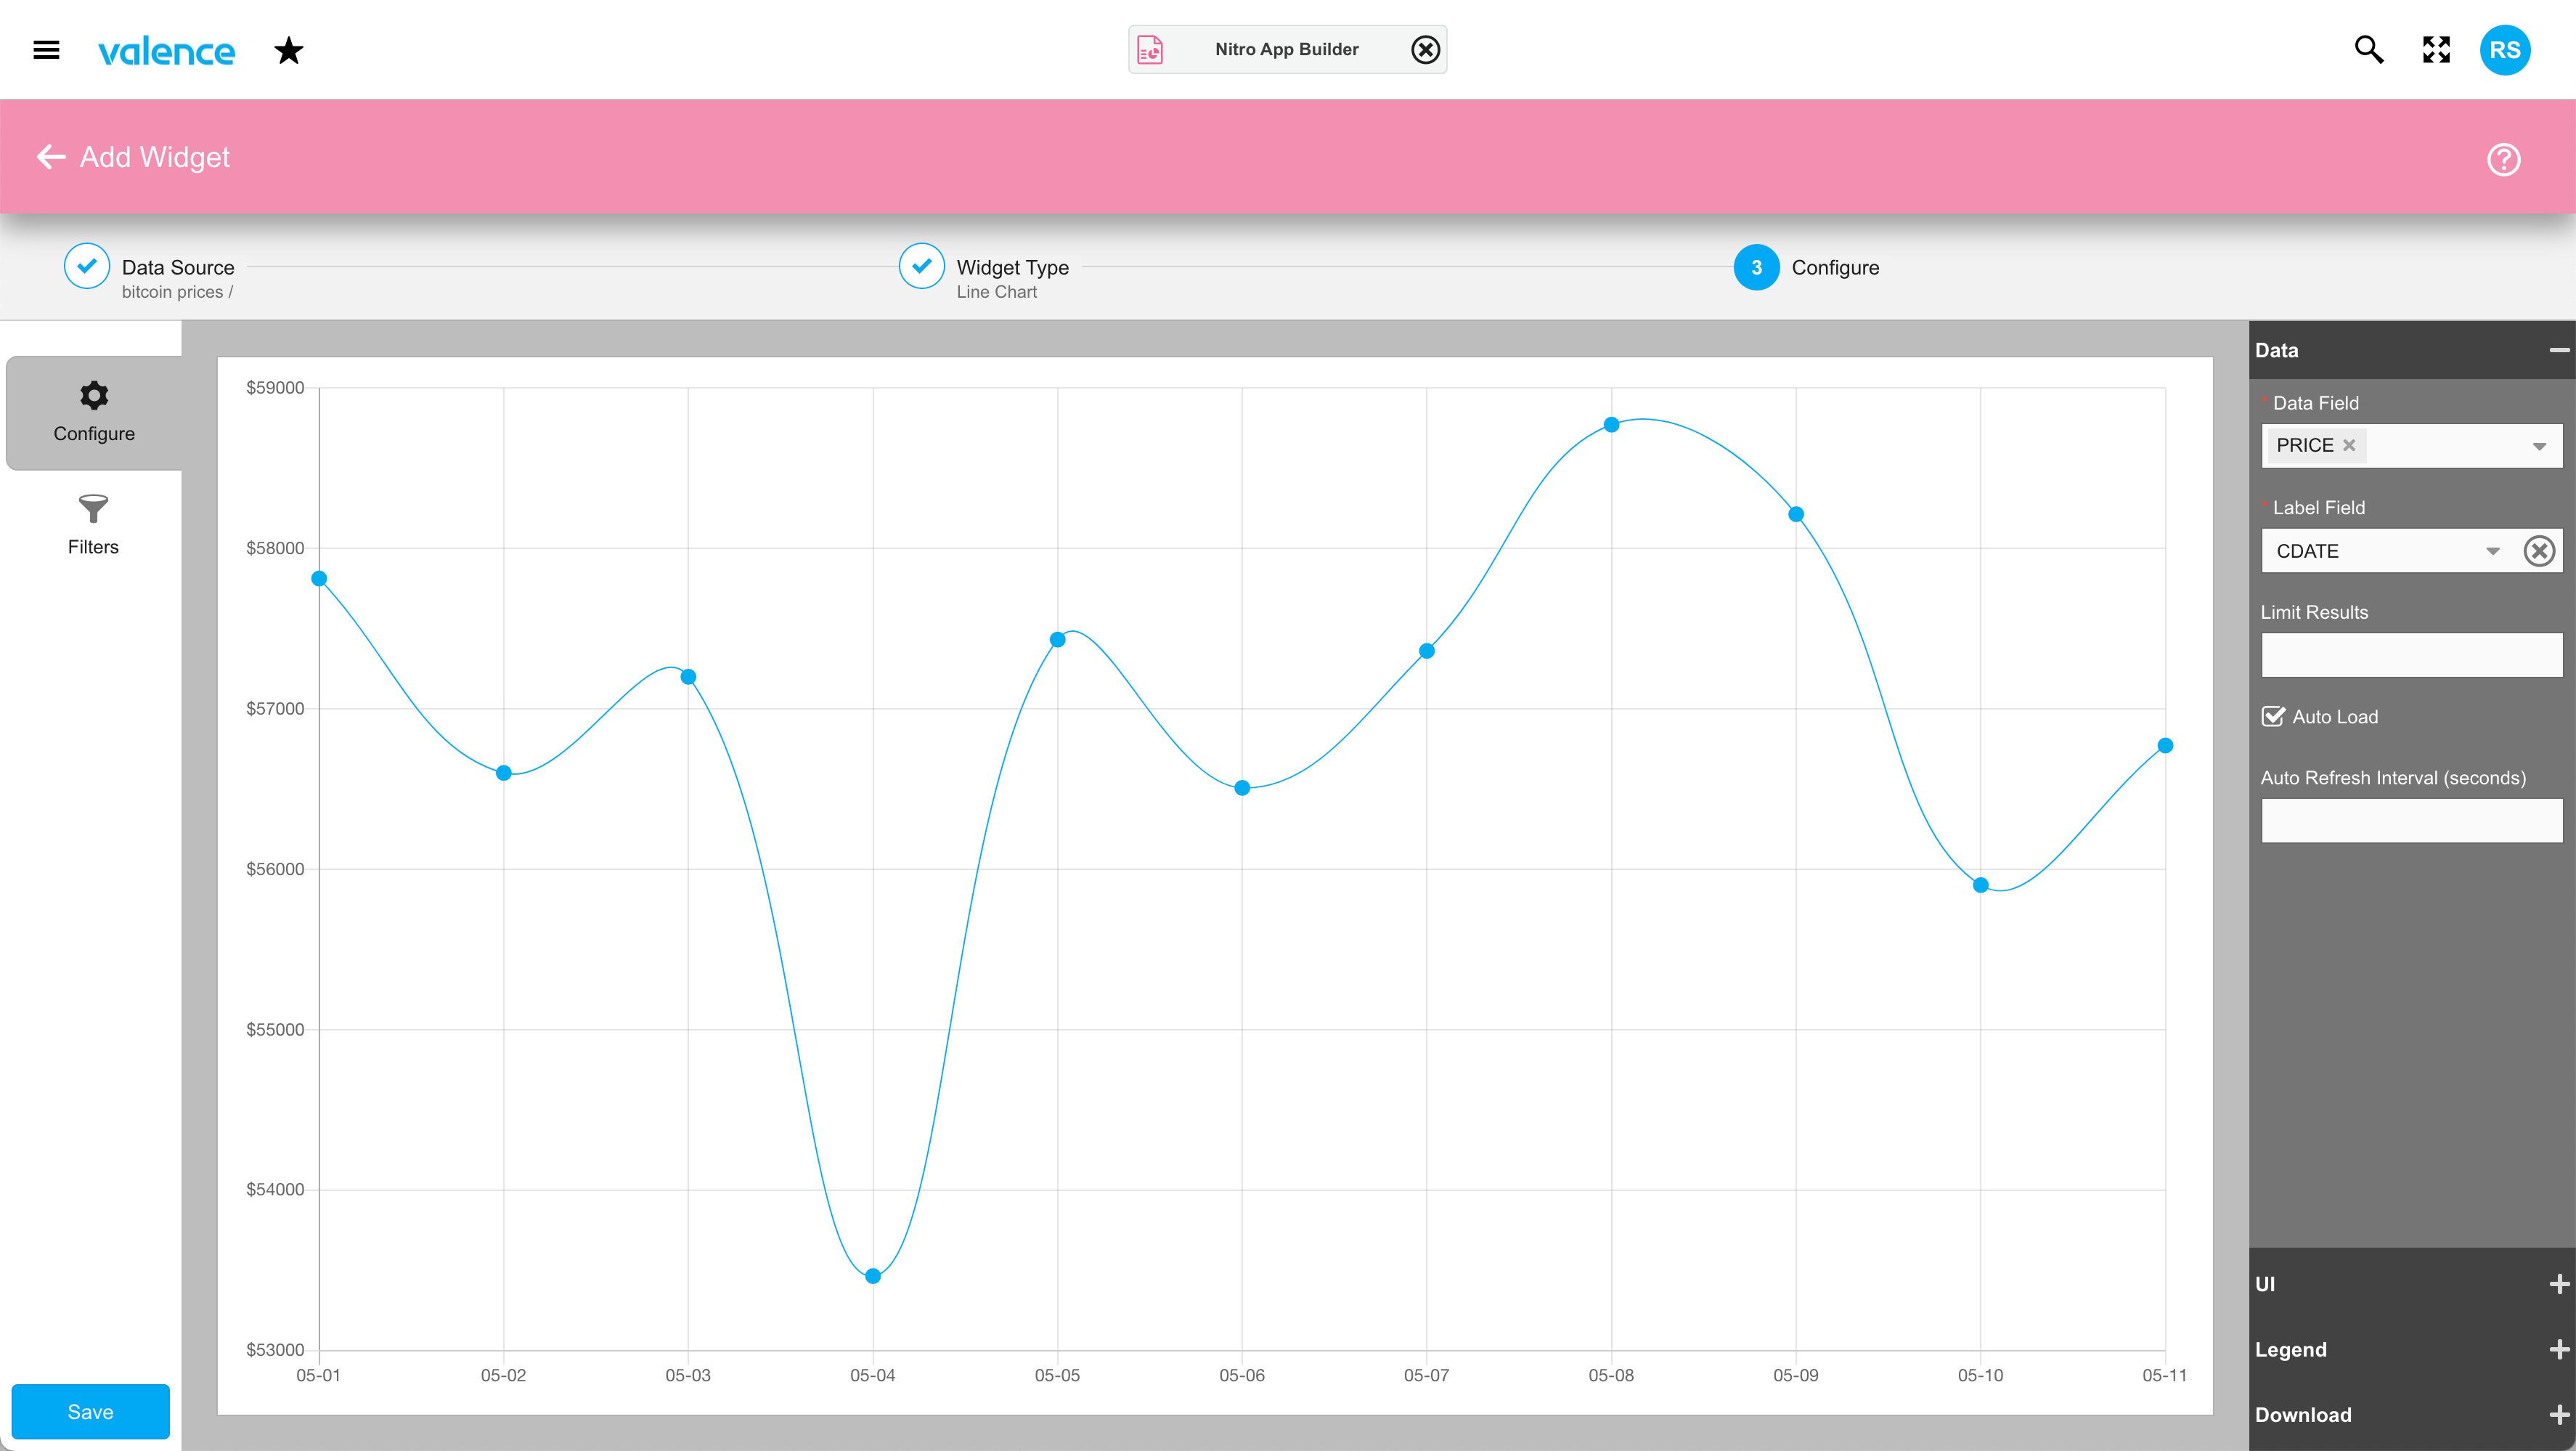
When you’re done configuring the widget, you can save it, place it into an app, then let your crypto-happy users have at it. In our training session we got a bit more fancy, adding a drop down filter so users could override the bitcoin segment of the URL via vvIn_virtual() to another currency. Like the current rage, Dogecoin.

Of course you can go way beyond merely pulling cryptocurrency prices for your apps, as there are thousands of public APIs available for your apps to use, in addition to countless other ones you can call with a paid key. ProgrammableWeb is one good resource for finding APIs that may suit your needs.
![CNX_logo [Converted]](https://0pkef6.p3cdn1.secureserver.net/wp-content/uploads/2023/05/CNX_logo-Converted-2.png?time=1722004789)
![CNX_logo [Converted]](https://0pkef6.p3cdn1.secureserver.net/wp-content/uploads/2023/05/CNX_logo-Converted.png?time=1722004789)