By far the most popular widget for business apps created with Valence’s Nitro App Builder is the Grid, with multiple options for rendering data cells. From simple display features like text alignment, currency/date renderers and conditional cell colors, to graphical images, formulas and conditional if/then logic using basic JavaScript — just about anything on your IBM i system can be depicted in a user-friendly fashion using a Grid, and numeric values can be easily summarized by simply checking a box.

For an additional level of configurability, the ability to customize a summary row cell based on the contents of other cells is now possible with the latest Valence 6.1 build. This means any summary row cell at the bottom of the grid can pull the values of other summary columns to customize its calculation, thus giving you flexibility that goes beyond standard summary functions like total, average, min/max, etc.
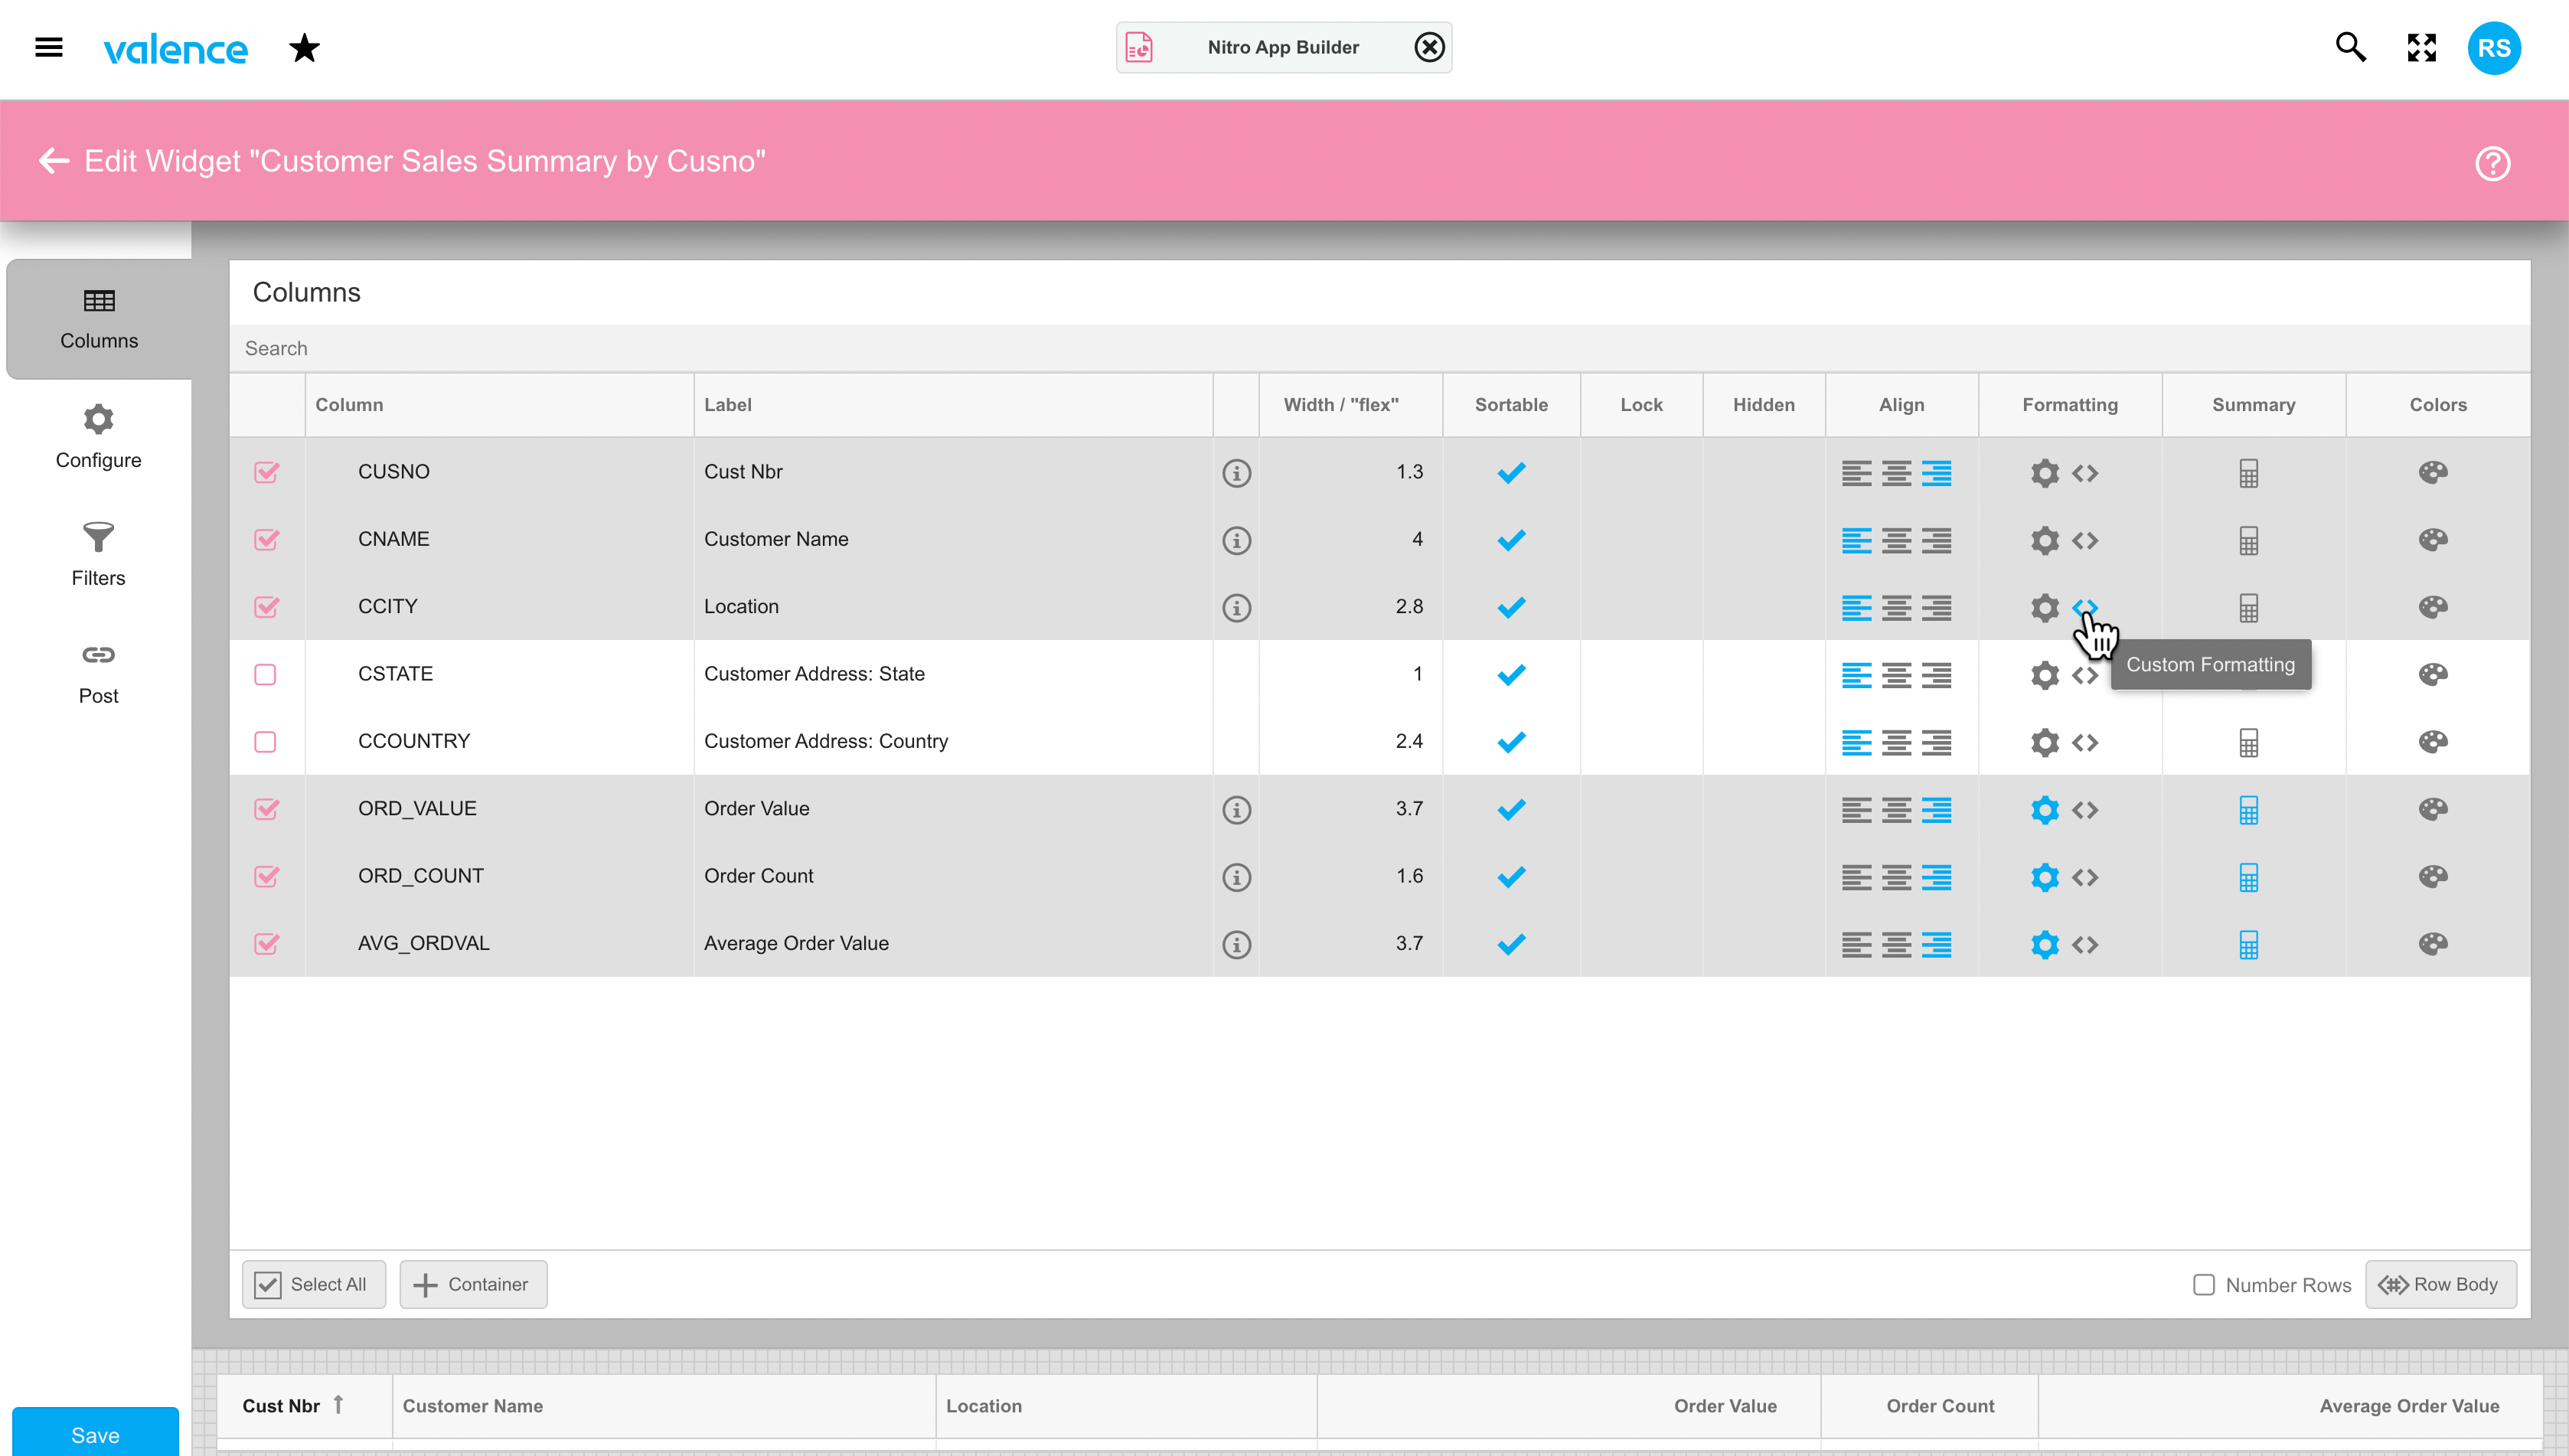
Before we dive into how to apply a custom format to a summary row cell, let’s review how it’s done on a regular row cell. In the grid widget configuration, you click on the <> symbol to access the panel for the custom renderer…
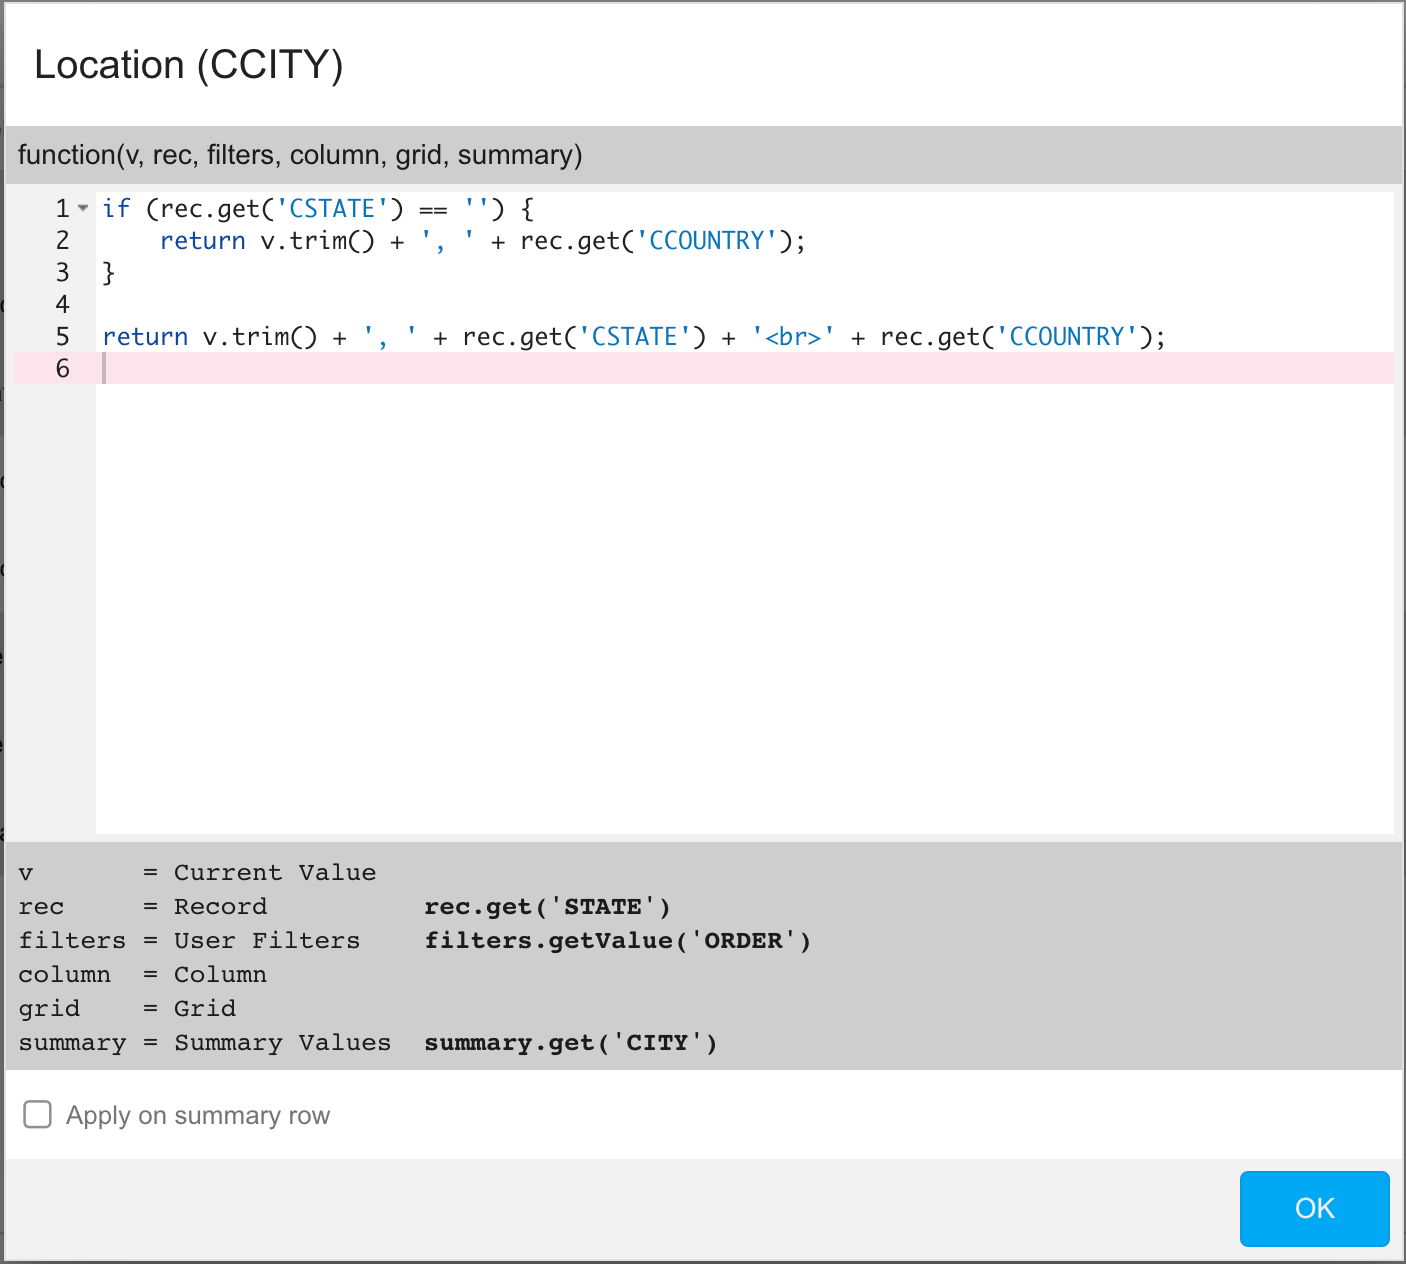
This brings up a window showing a JavaScript function that will be applied to each row for the column. The function includes, as of build 6.1.20230224, six parameters you can put to use in determining what you want rendered in the cell:
- v – the “raw” value of the cell coming from the underlying data source
- rec – a reference to the entire row, from which you can pull values for other columns
- filters – a reference to any filters applied to the grid, from which you can pull any filter values the user has specified
- column – a reference to the current column
- grid – a reference to the entire grid object
- summary (new as of 6.1.20230224) – a reference to the summary row, from which you can pull values for other summary cells. Regular (non-summary) rows can utilize this parameter as well.
Your custom renderer function must conclude by returning the value you wish to display (i.e., return v;). Standard HTML formatting is supported in the cell, so your returned value can include <br> to insert line feeds, or you can put text in <i>italics</i>, <b>bold</b>, <u>underlines</u>, etc. You could also add a convenient tooltip (special text users would see when they hover their mouse over the cell) by injecting a data-qtip <div> into the returned value, as explained here.
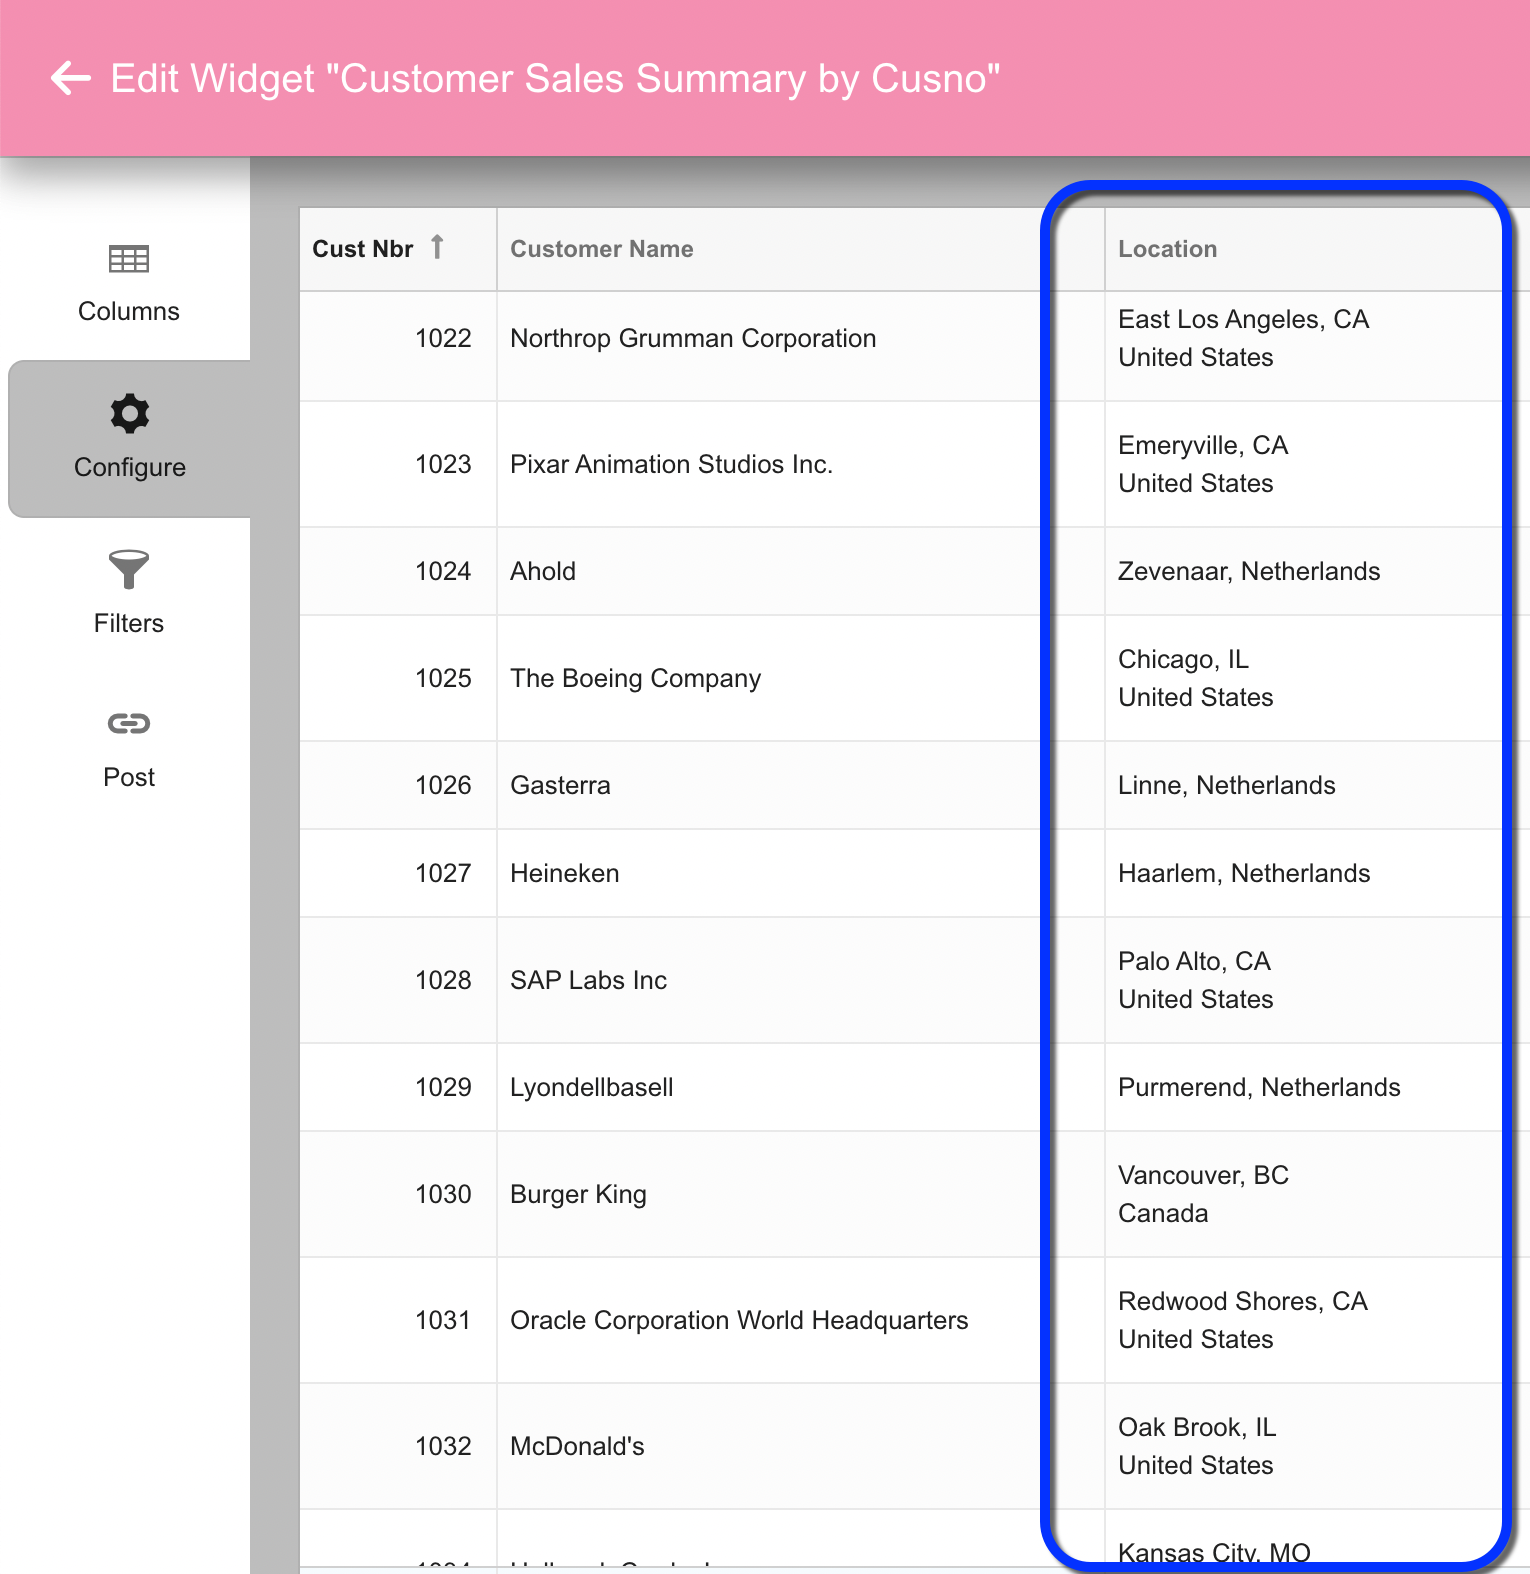
The rec parameter is useful for pulling data from other columns in the data source — not necessarily columns included or visible in the grid — to help construct what shows in the cell of your custom renderer. In the example above, we’re pulling the state and country value from another column using rec.get(‘CSTATE’) and rec.get(‘CCOUNTRY’) and appending the values to v such that the country shows as a separate line on the City column when state is not blank.
In rare cases you may be interested altering a cell’s content based on what the user has specified for a filter value. For that situation you can retrieve filter entries using filters.getValue(‘field_name’), where field_name is the column over which the filter is being applied.
In even more obscure/advanced cases you might need to gain access to the core Ext JS column or grid object via the column and grid parameters respectively. We’ve seen this approach used at some sites to adjust the appearance of the entire row, or alter the column heading. This gets rather deep into the JavaScript weeds so we won’t delve into that here — you can post a question on the Valence Forum if you have questions on that.
Finally there’s the summary parameter, which operates similar to the rec parameter, except it’s a reference to the values on summary row cells. Your renderer logic can detect when it’s being called on a summary row by virtue of summary.isRow being set to true, which we’ll see in a moment. It’s also possible to programmatically “force” a summary cell to appear on columns that you’re not explicitly summarizing by checking the “Apply on summary row” checkbox. This checkbox which will only appear on columns that are not already set to summarize.
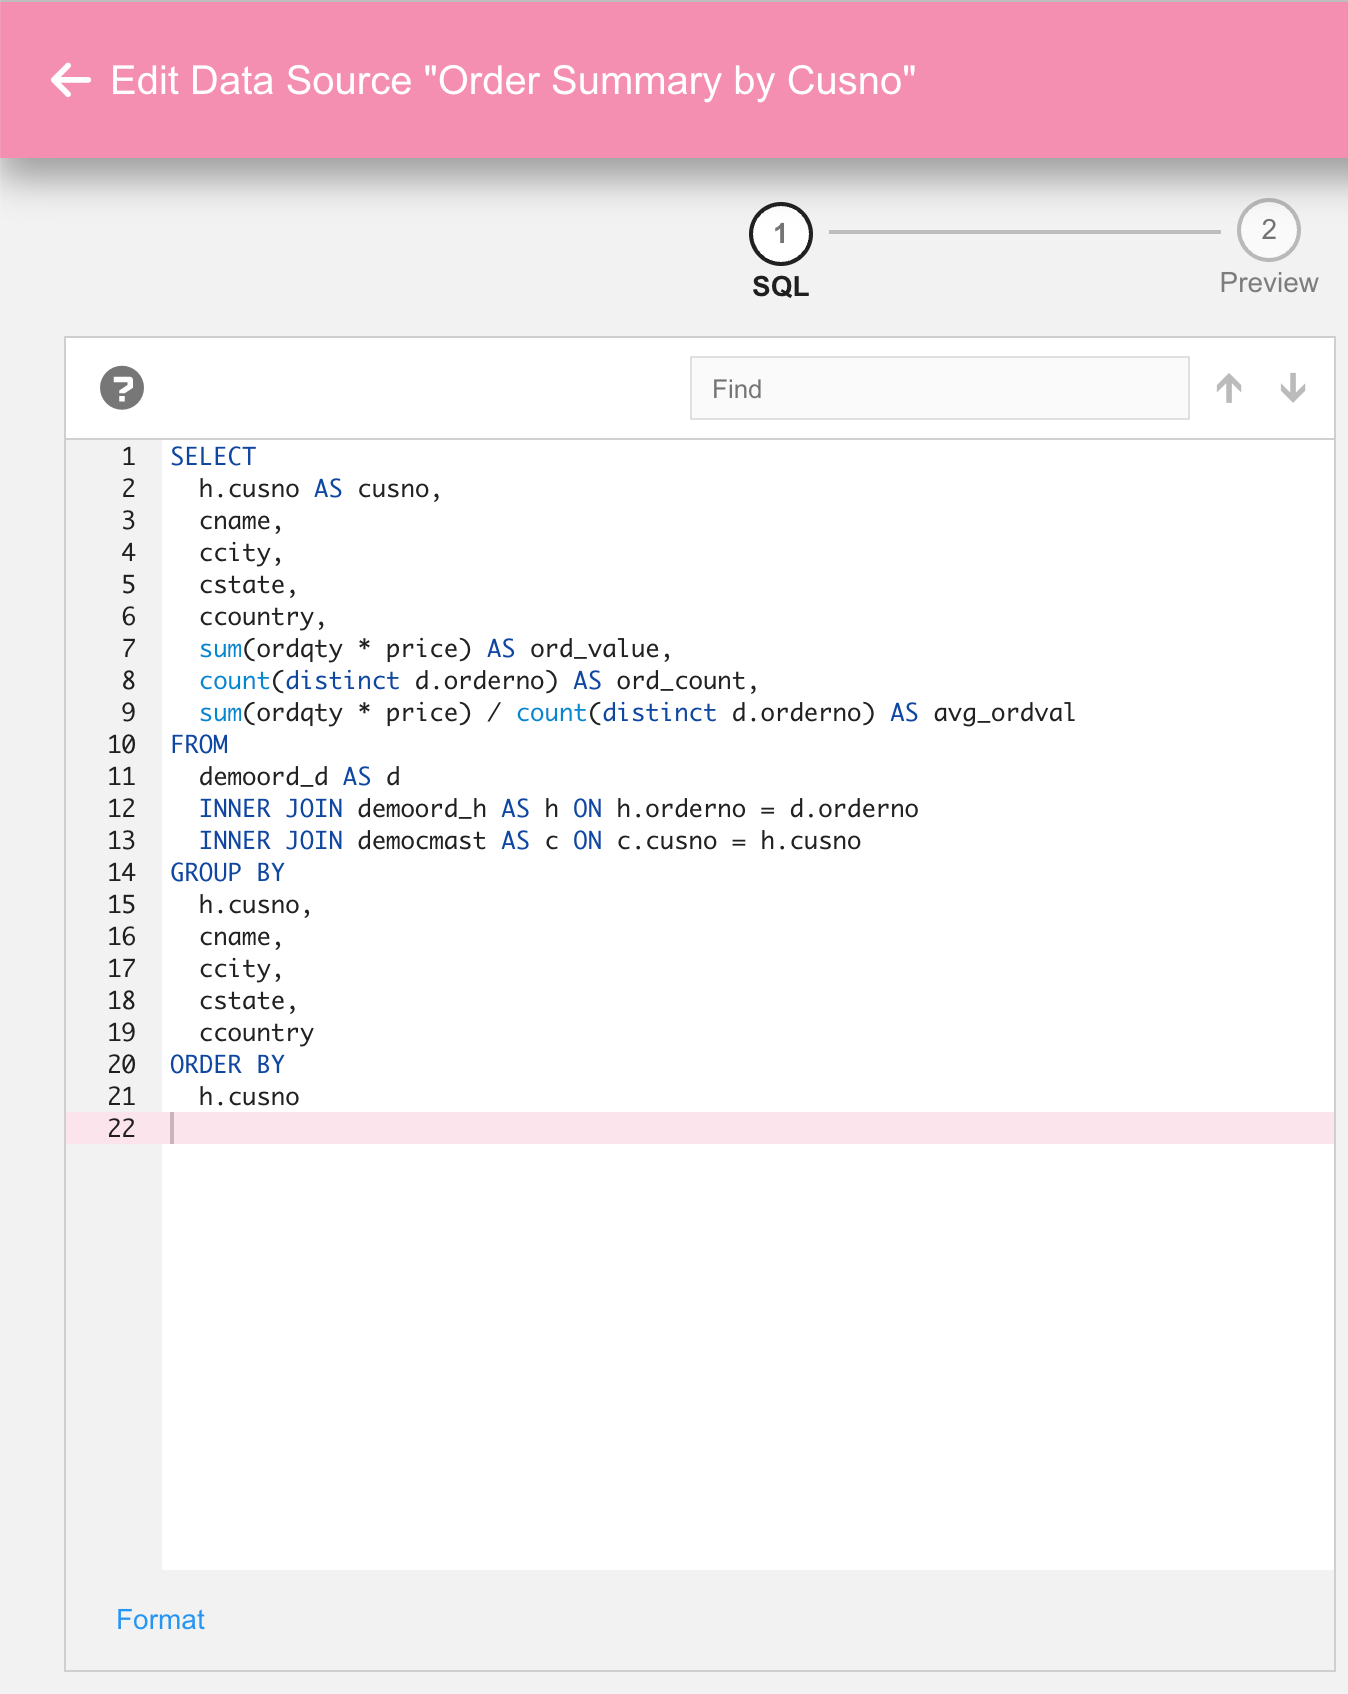
To illustrate this concept in action, below is an SQL statement for a hypothetical data source behind the grid above that summarizing order values by customer. In this case there are three calculated columns grouped by customer: One summarizing the total order values, one showing the total order count, and one showing the average dollar value per order.
Our grid can display these calculated values, then summarize them at the bottom by clicking on the calculator icon on the configuration tab and then selecting one of the summary functions. For example, we could have it total/summarize the order value and order count columns, and show an average of the average order values.
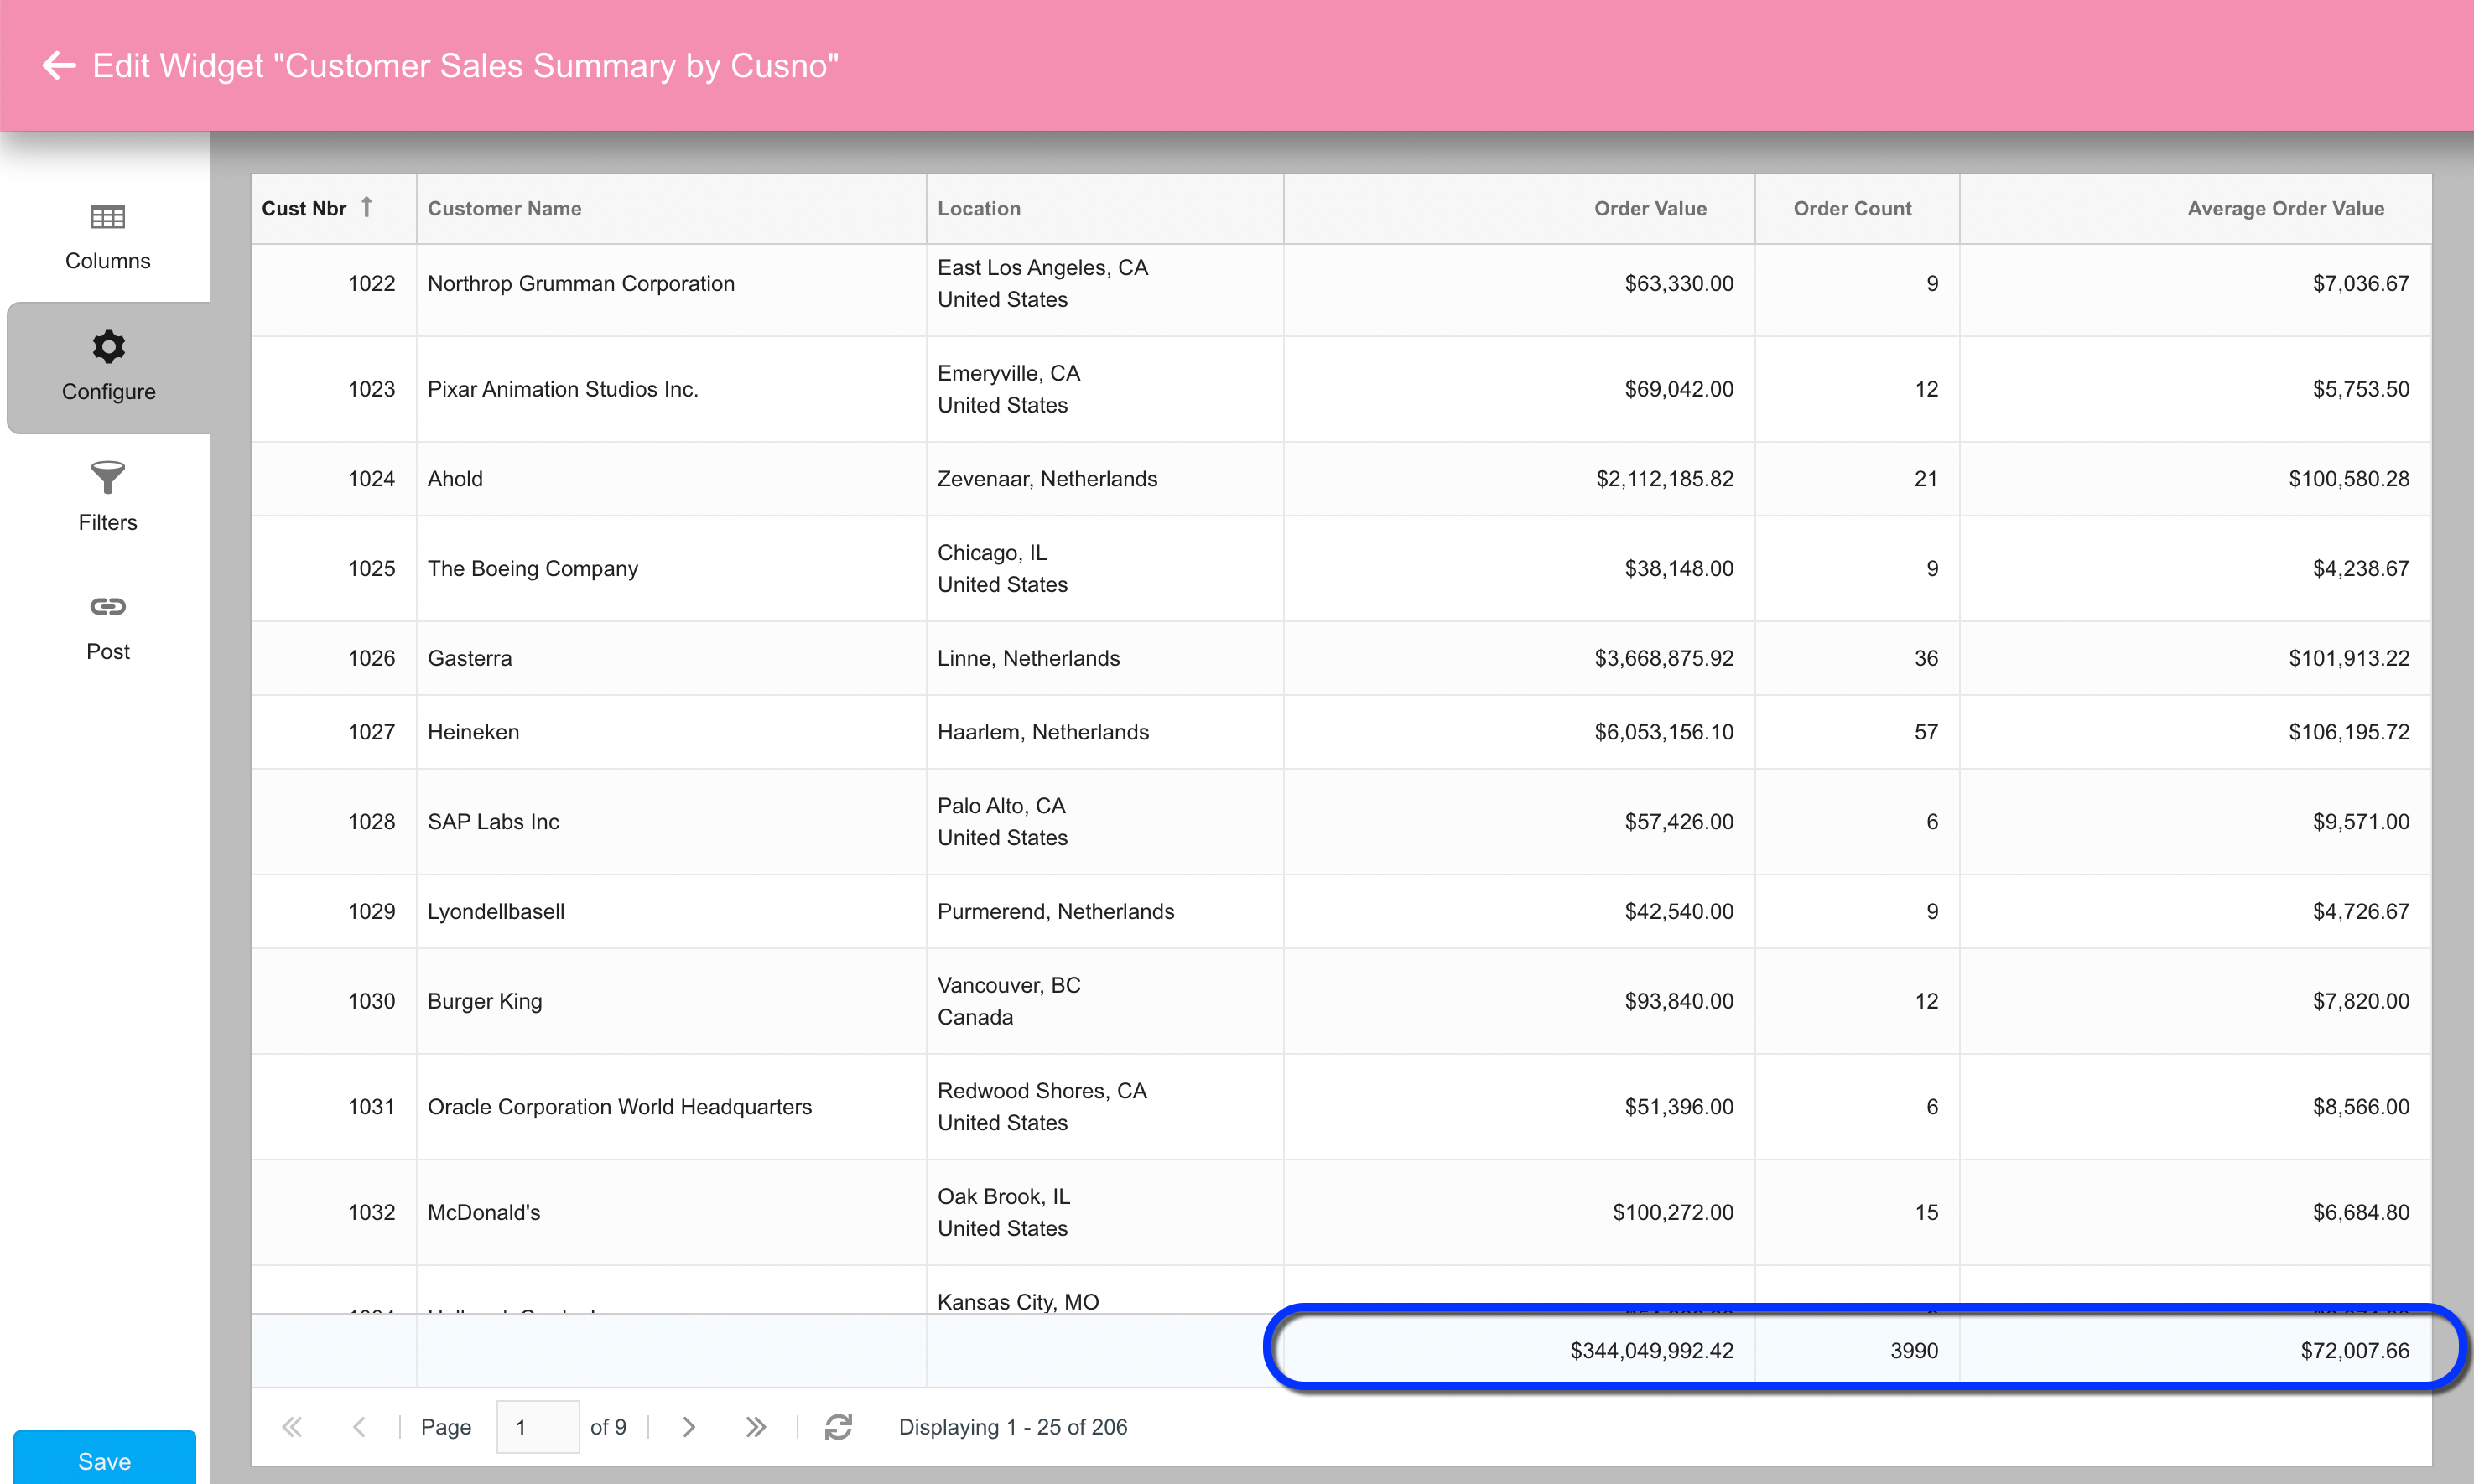
The problem with showing an average of the average order values on the summary row like this is that it’s giving equal weight to each regular row (customer), rather than showing a true average value per order. This is where the ability to override what shows in the summary cell comes into play. To get a true average order value across all orders, we would want the summary value to be the result of dividing the total order value by the total order count, which we can get to by configuring a custom renderer on the AVG_ORDCAL column like this:
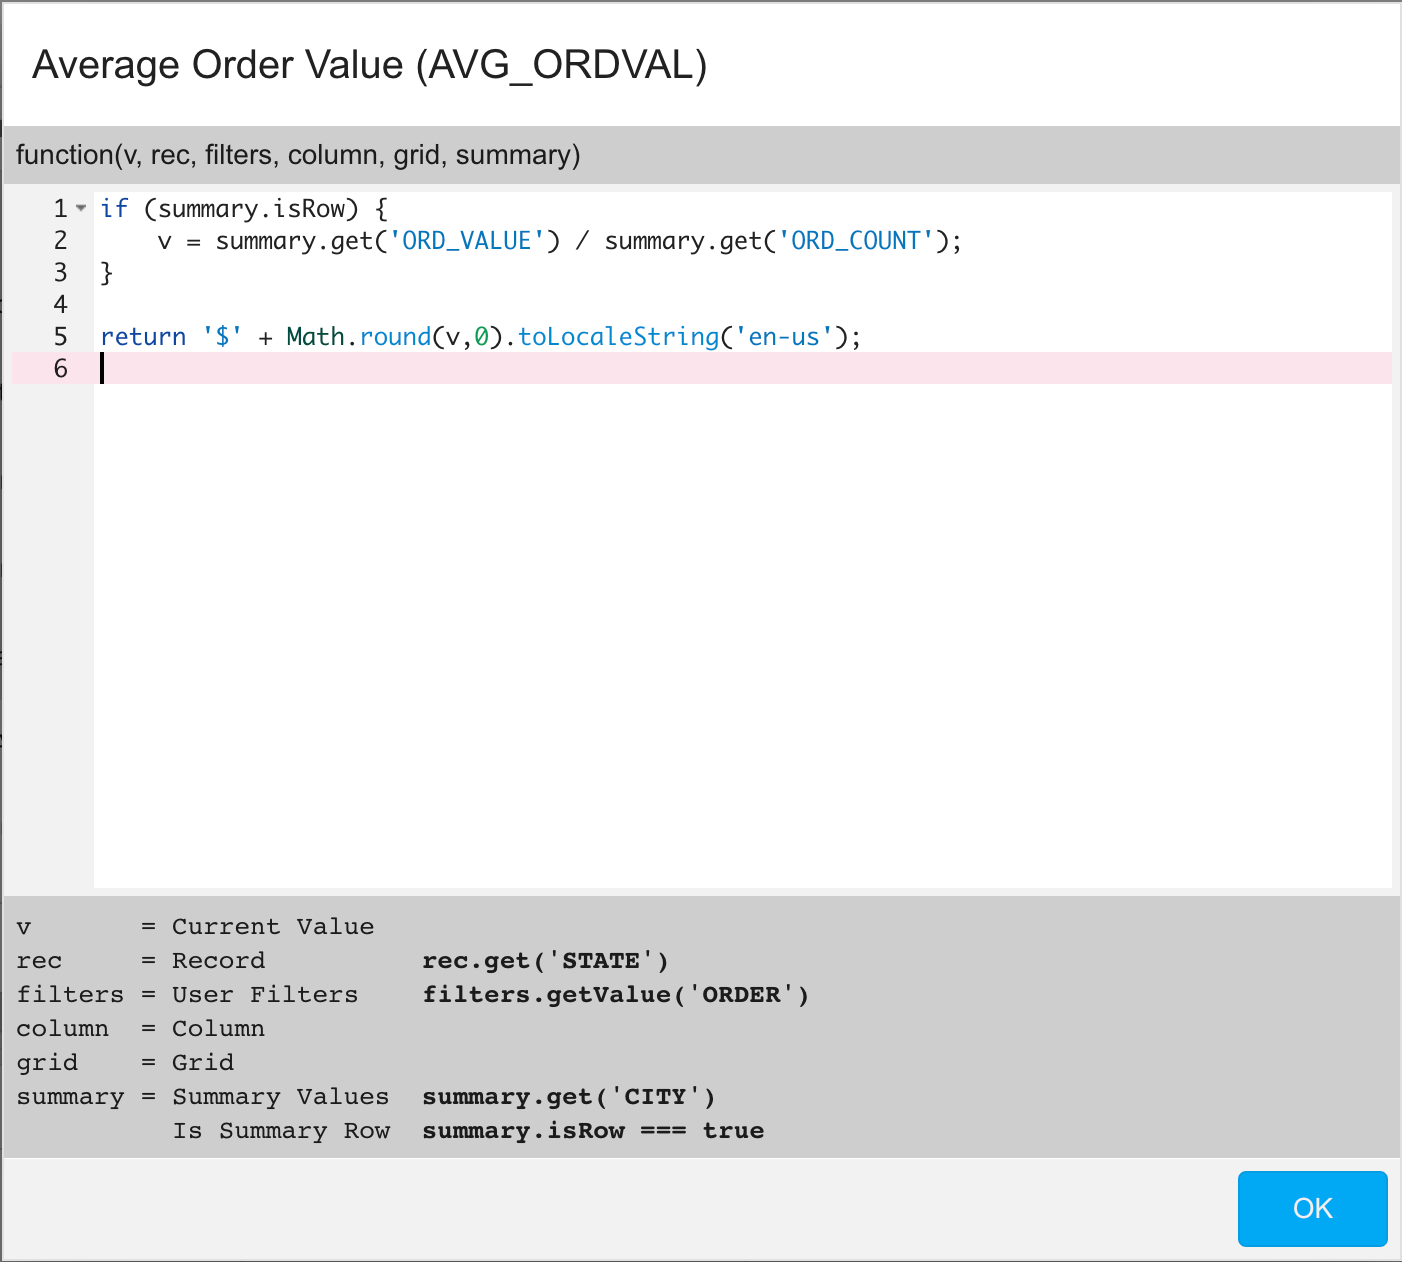
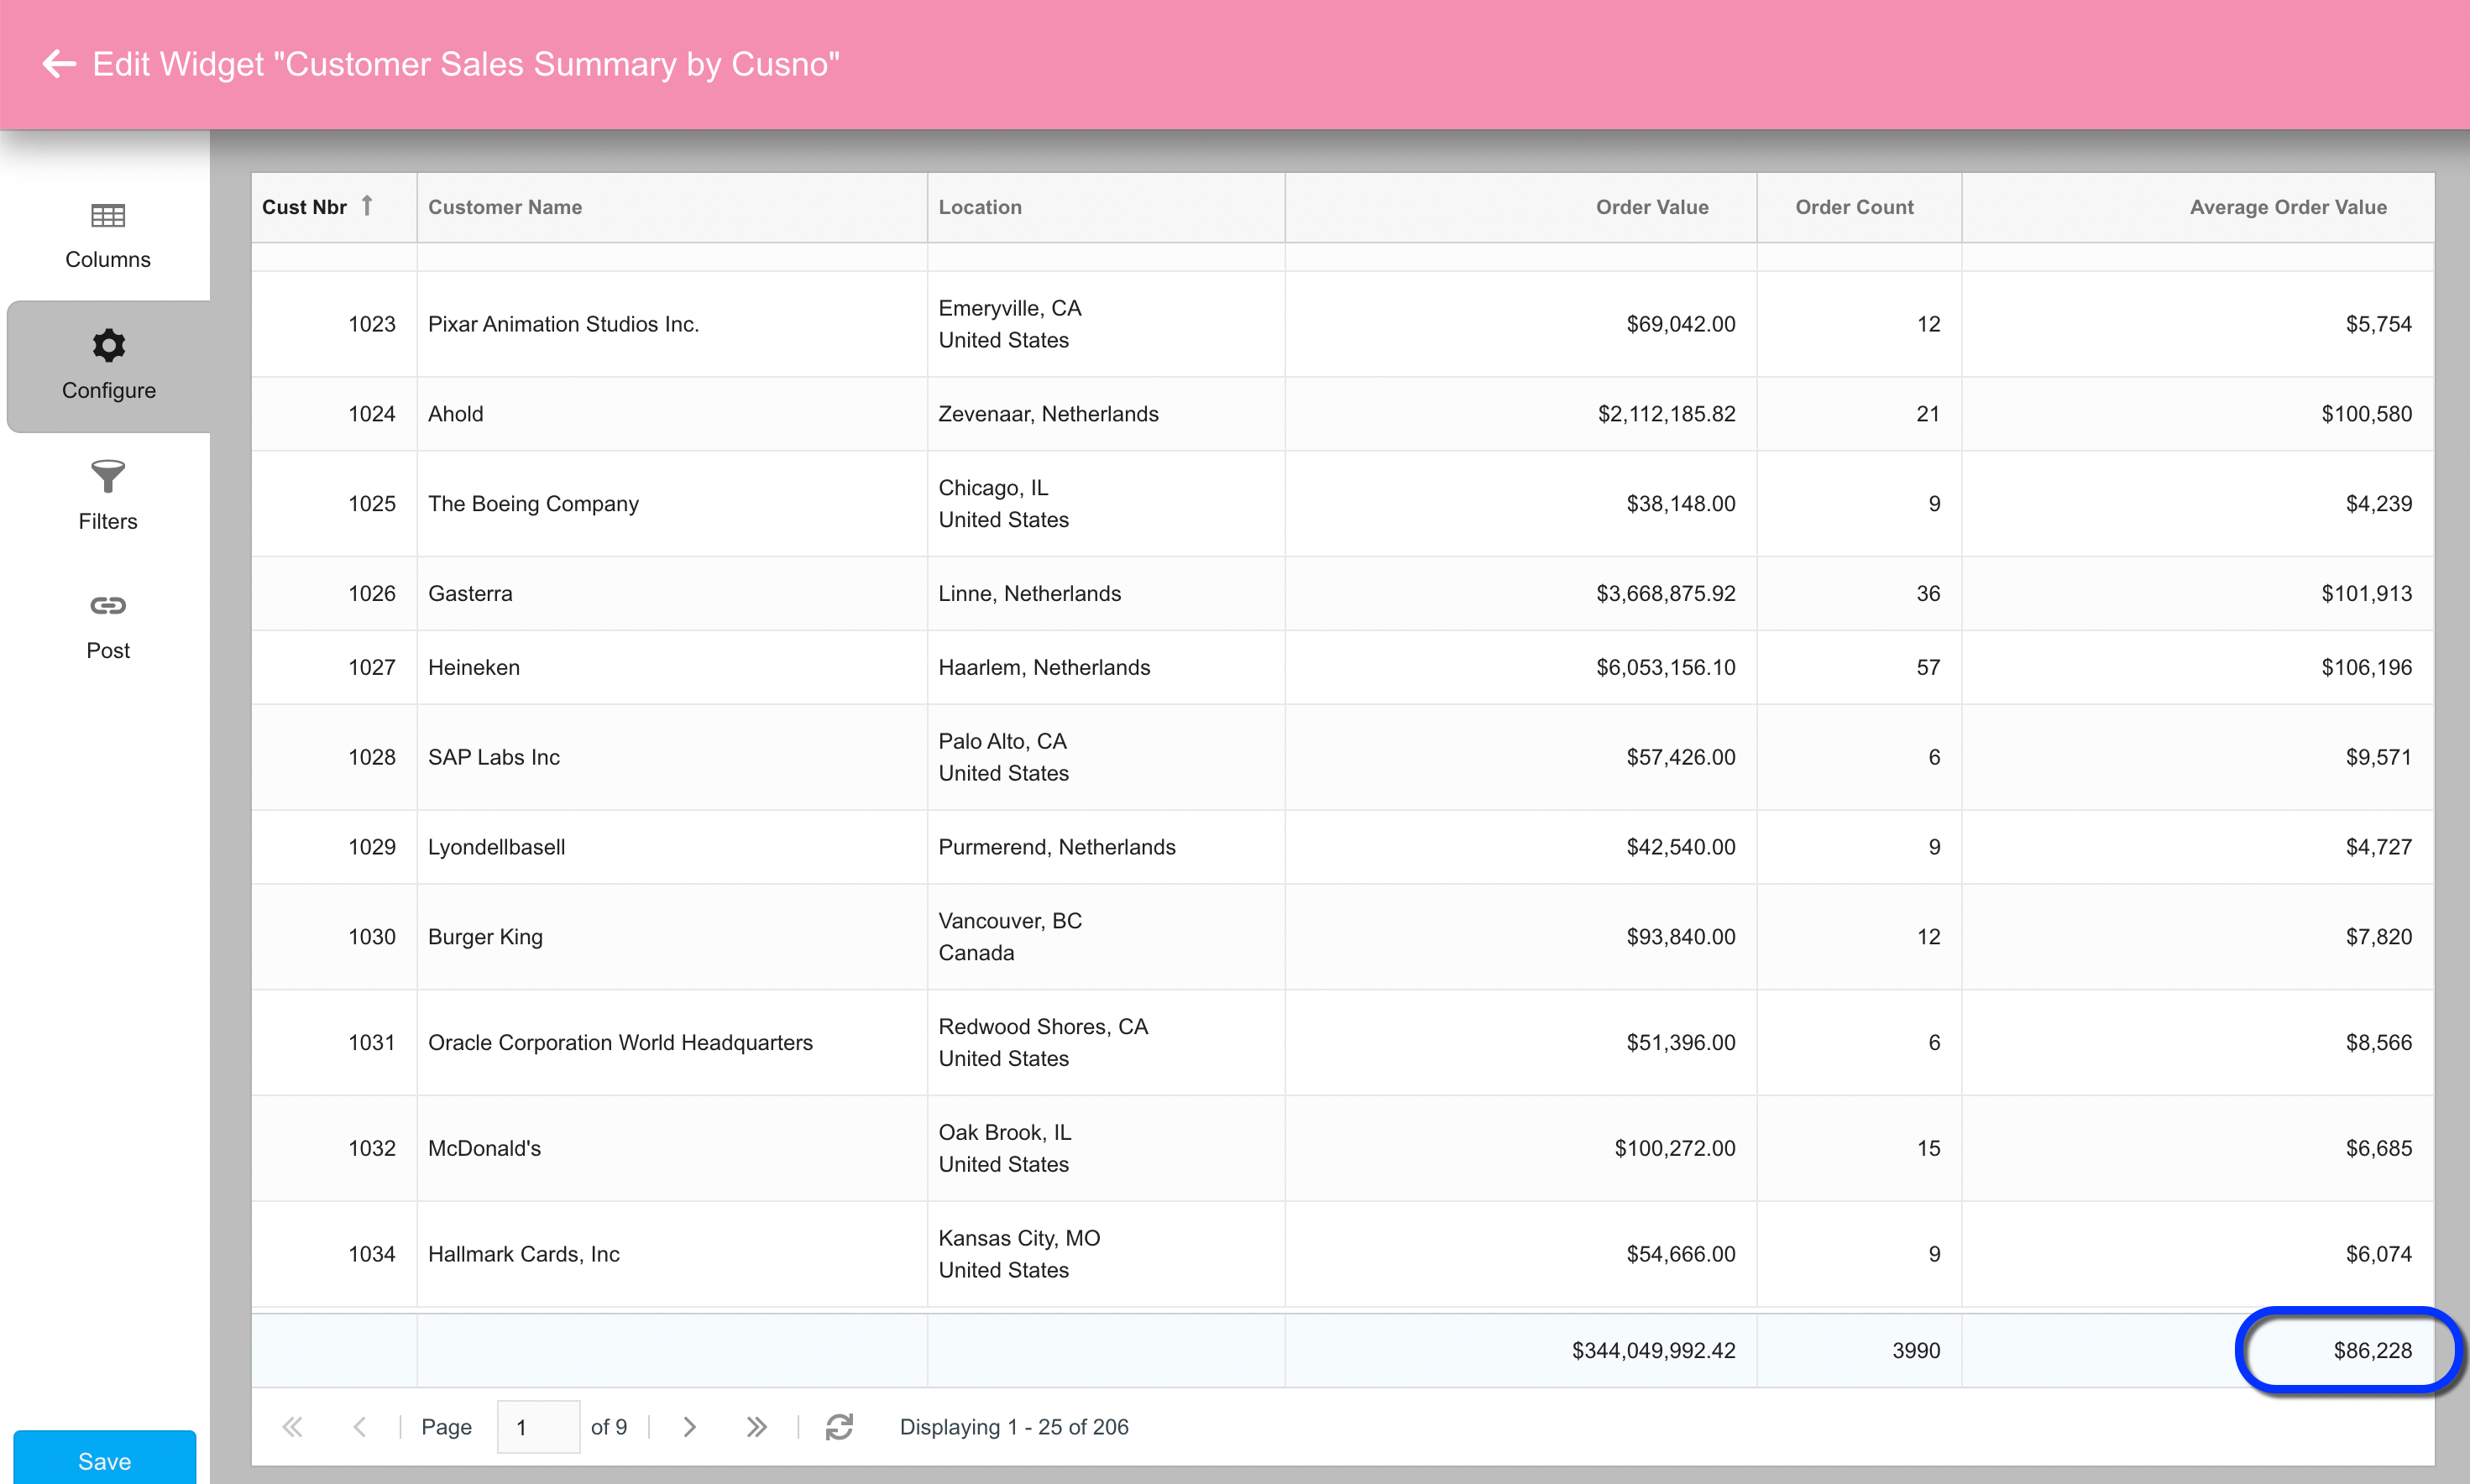
So in essence, we’re doing an on-the-fly calculation over summary values (note that the logic “knows” when it’s inside a summary cell by testing the value of summary.isRow). Since our custom JavaScript code here is taking over the cell’s contents entirely, it’s the code’s job to likewise handle the formatting, as the code is being invoked in lieu of one of the standard cogwheel renderers. In this case, we’re rounding to the closest whole number and adding comma separators along with a dollar sign prefix, resulting in a summary row that shows a different calculated value for the average order amount:
By the way, there are myriad examples out there depicting how to manipulate numbers and strings in JavaScript like this, which you can land on with a quick Google search (i.e., “JavaScript format number”). The code used in the example above was pulled from here.
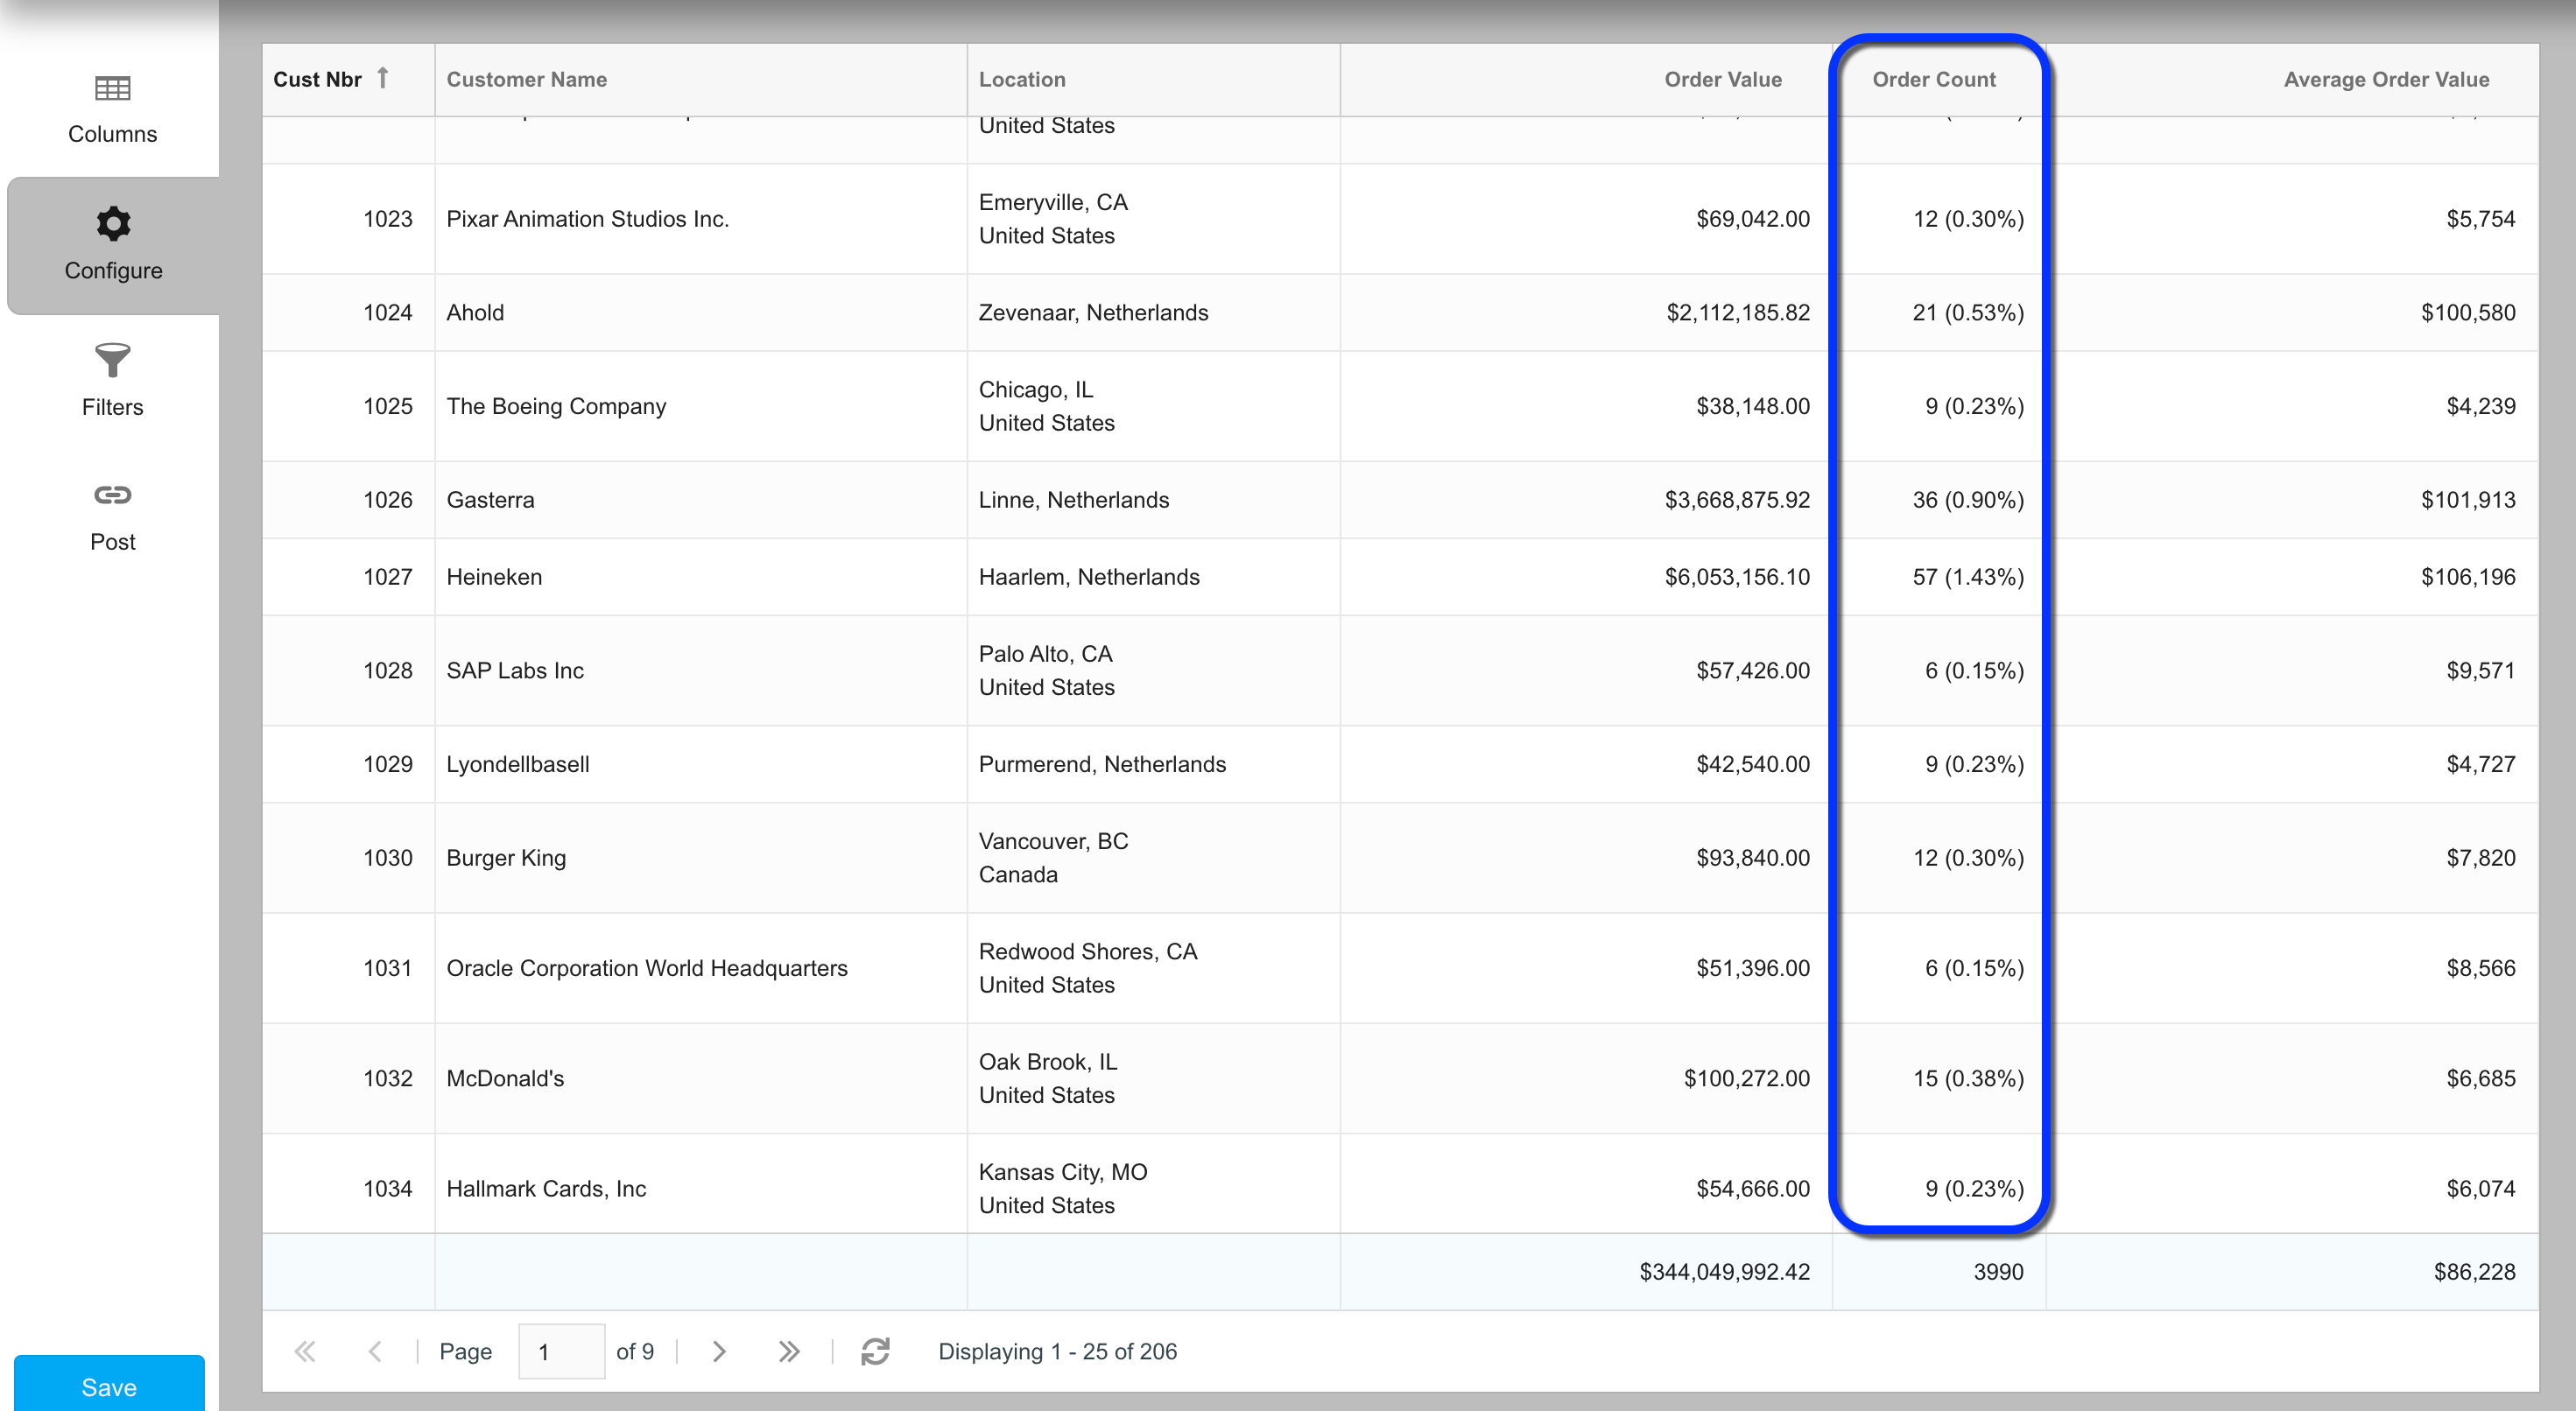
As mentioned earlier, another nifty trick you can do with the summary parameter is pull summary values into a calculation on a regular row. For instance, if you wanted to show a customer’s relative percentage of the total order count, you could pull in the summary total to calculate the percentage, then append it to the order count column, like this:
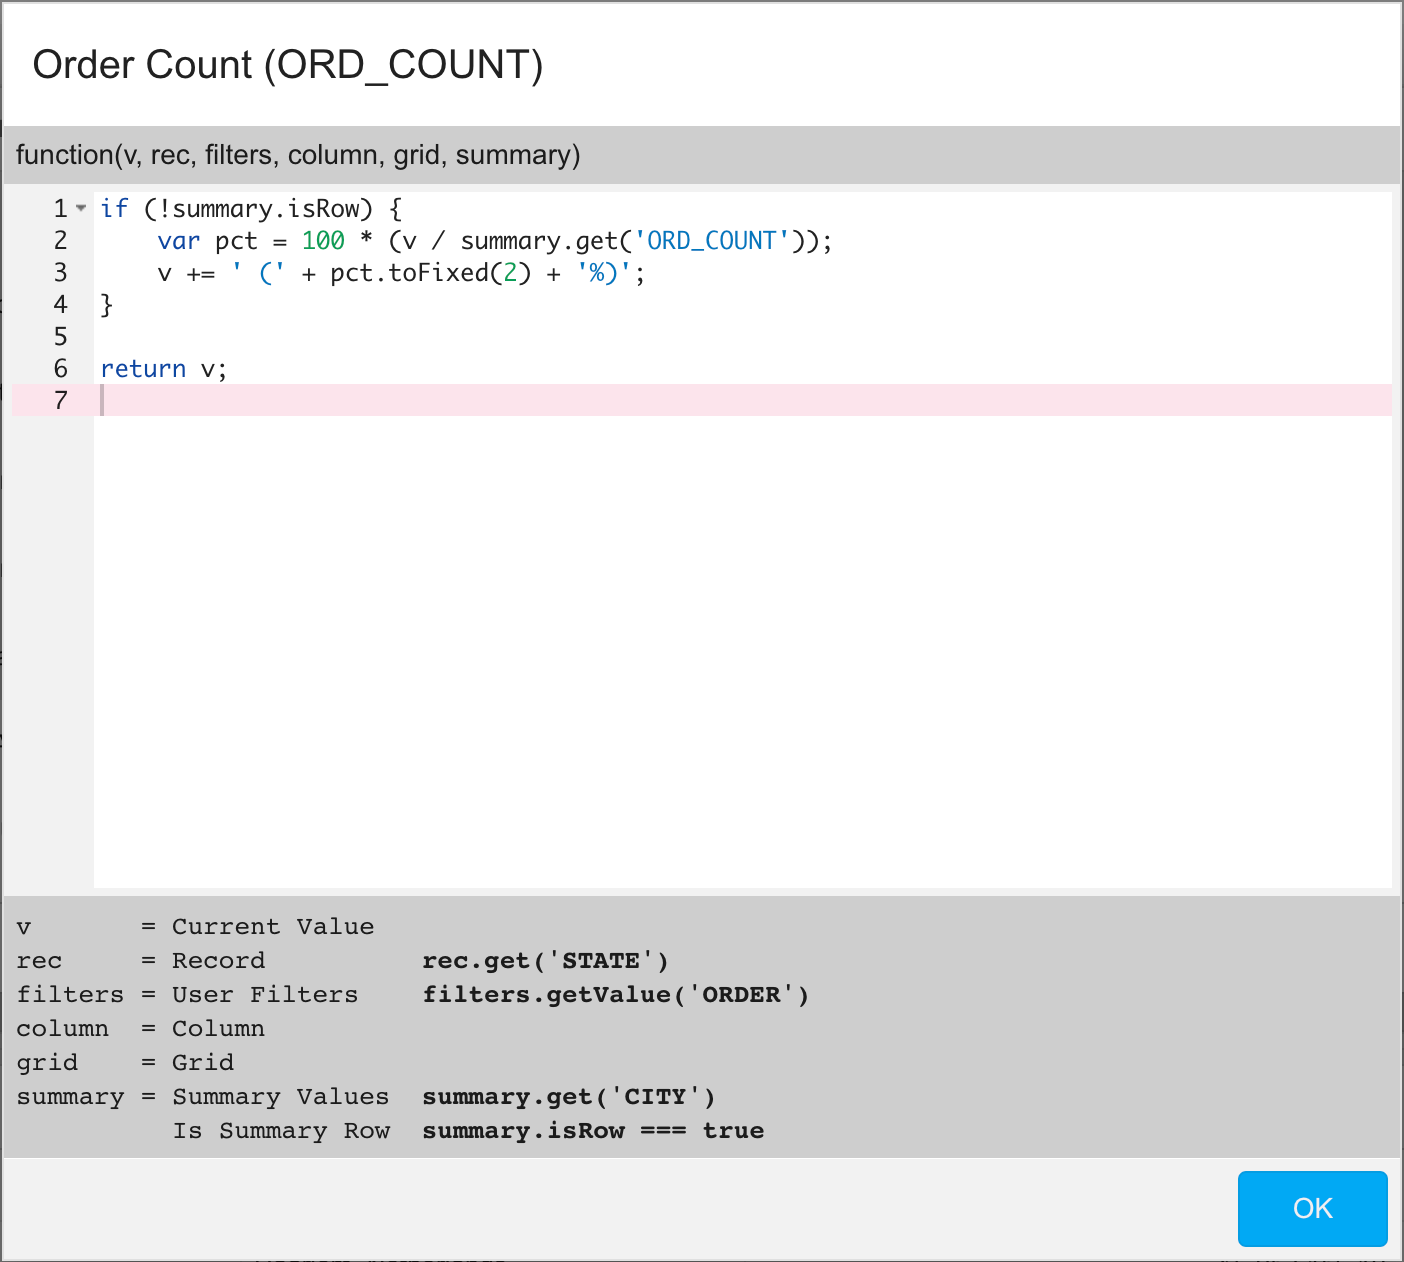
Resulting in regular row cells that look like this: