
One of the most common requirements in a modern business application is the need to present users with easily digested summaries of data in list form. The ability for inquiring minds to quickly and easily drill down into that summarized data to glean specific details where needed is an added bonus. As such, the Ext JS Pivot Grid — complete with auto-summing cells and expandable rows — is a fantastic tool for combining summary and detail information together in a highly intuitive user interface. Available to developers who have purchased the Sencha Ext JS Premium package, this impressive Pivot Grid functionality is also available to non-developers as part of the Nitro Query utility included in Valence 5.1. In other words, anyone with a basic understanding of their IBM i database can quickly build out an impressive Pivot Grid-based report on their system — all without writing a single line of code!
This tip explains how. For purposes of demonstration, we’ll use the DEMOCMAST and DEMOORDER sample files included with Valence to build a summary of sales by year and country, allowing the user to drill down into state, city, zip code and customer-level detail as needed. The first step to building a pivot grid in Nitro Query App Builder is not much different than a conventional grid application. With your desired file name(s) and fields in hand, simply define your data source and save it.
When you’re ready to try it yourself, launch the Nitro Query App Builder app and click the pink plus icon in the lower right to begin creating a new data source. For purposes of learning the basic Pivot Grid functionality here, walk through the steps in the data source wizard as follows (each number below corresponds to the steps at the top of the Data Source wizard page):
- Specify DEMOCMAST and DEMOORDER as the file names (enter the first file name, click Add, then enter the second file name and click Add). Click Next to move on to the next step.
- Join the two files together on the customer number. Click on “Add Mapping”, select the CUSNO field from the first prompt, then CUSNO again from the second prompt. Proceed to the column selections in step 3.
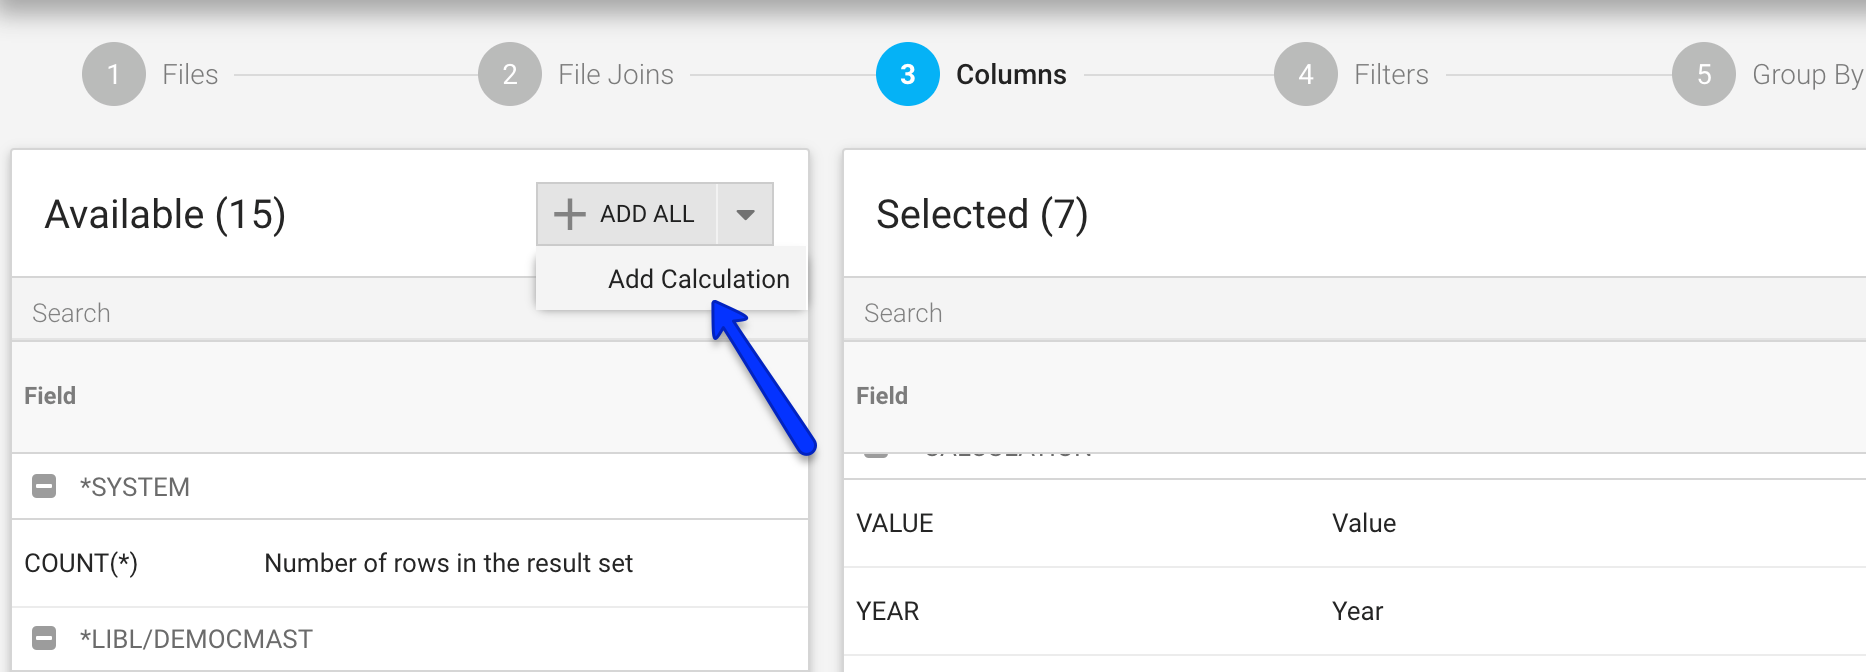
- Select columns CNAME, CCITY, CSTATE, CCOUNTRY, CZIP. Then create two calculated columns (this is done by clicking on the down arrow to the right of add all and selecting the “Add Calculation” item, as shown here. Create one summation column named VALUE to get the order value for each record in DEMOORDER. The calculation should be SUM(F2.ORDQTY * F2.ORDAMT). Then create another column called YEAR to derive the sales year for each record in DEMOORDER. The calcuation for this field should be YEAR(F2.ORDDATE).
- No filters needed. Proceed to the next step.
- Verify that the appropriate Group By columns have been auto-selected. Since VALUE is the only aggregate column, you should see the rest (YEAR, CNAME, CCITY, CSTATE, CCOUNTRY, CZIP) listed as the grouping fields.
- For a pivot grid you’ll typically want the Order By clause to go from largest entity to smallest entity. So set your order by fields in this order: CCOUNTRY, CSTATE, CCITY, CZIP, CNAME.
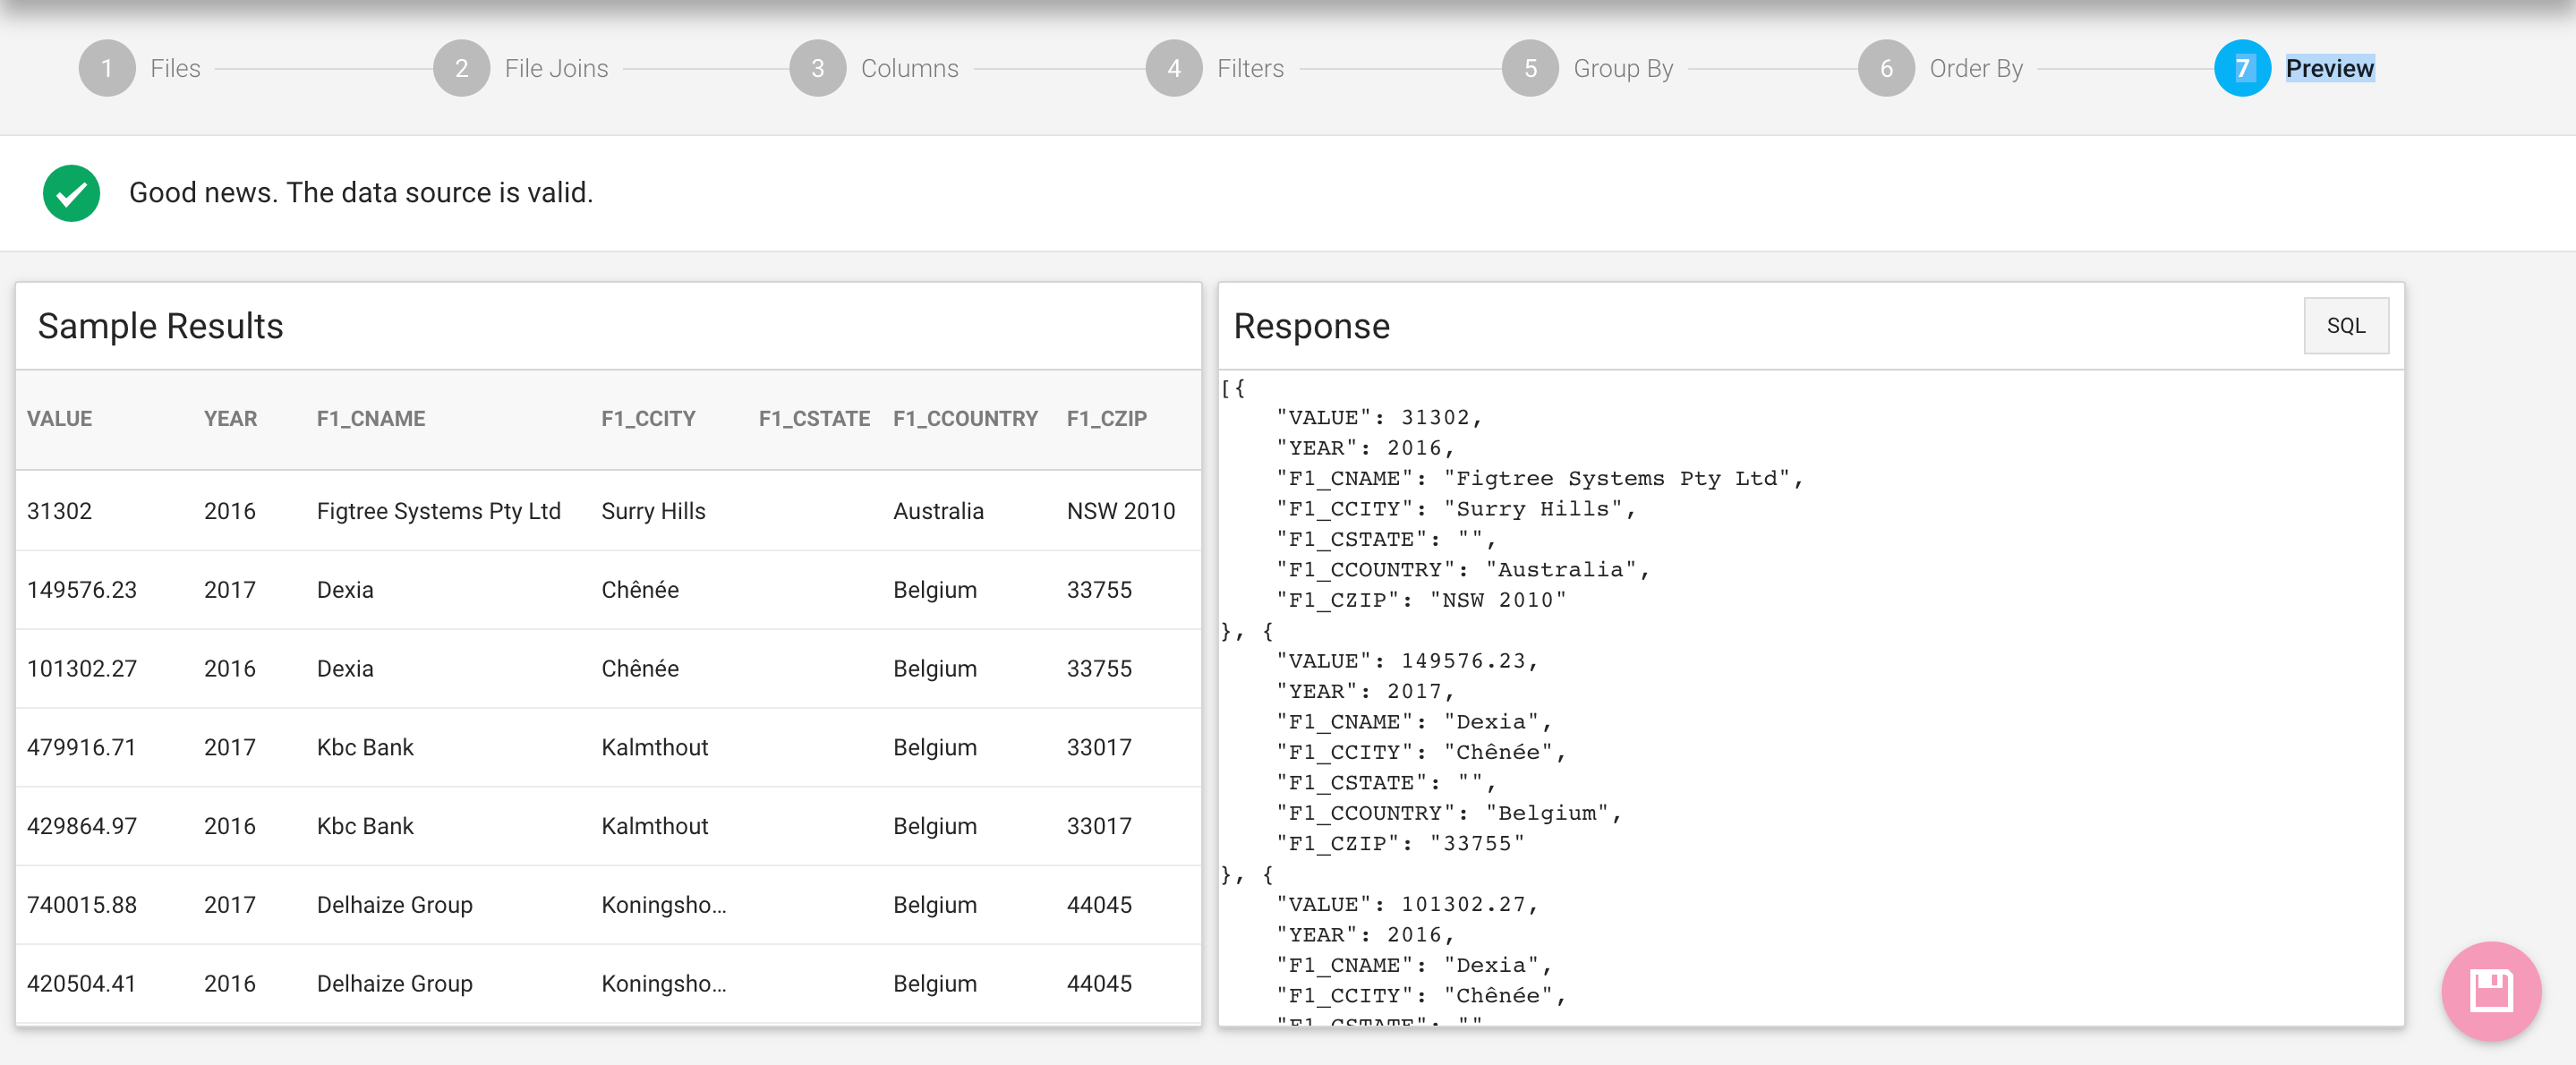
- If you’ve configured your data source properly you should see a preview that looks like like this:
Click the Save button and give your data source a name. Now we’re ready to create a widget from our data source, except this time we’re going to create a Pivot Grid. So find the data source you just created, click the row menu to the left of it and select Create Widget. Then double-click on the Pivot Grid icon, as depicted here: Once selected, we’re presented with a bunch of Pivot Grid-related configurations.
The first step is to select your columns and drag them up or down into a logical sequence. So in our case we want to order our columns in the following sequence: F1_CCOUNTRY / F1_CSTATE / F1_CCITY / F1_CZIP / YEAR / VALUE For selections, ensure you have the first five fields checked in the “Left Axis” column; Make the YEAR field the “Top Axis” and make the VALUE the “Aggregate”. In doing this you’re telling the grid what will make up the expandable entities on the left, the summary at the top level, and the summary at the detail level. Your resulting selections and preview should look something like this:
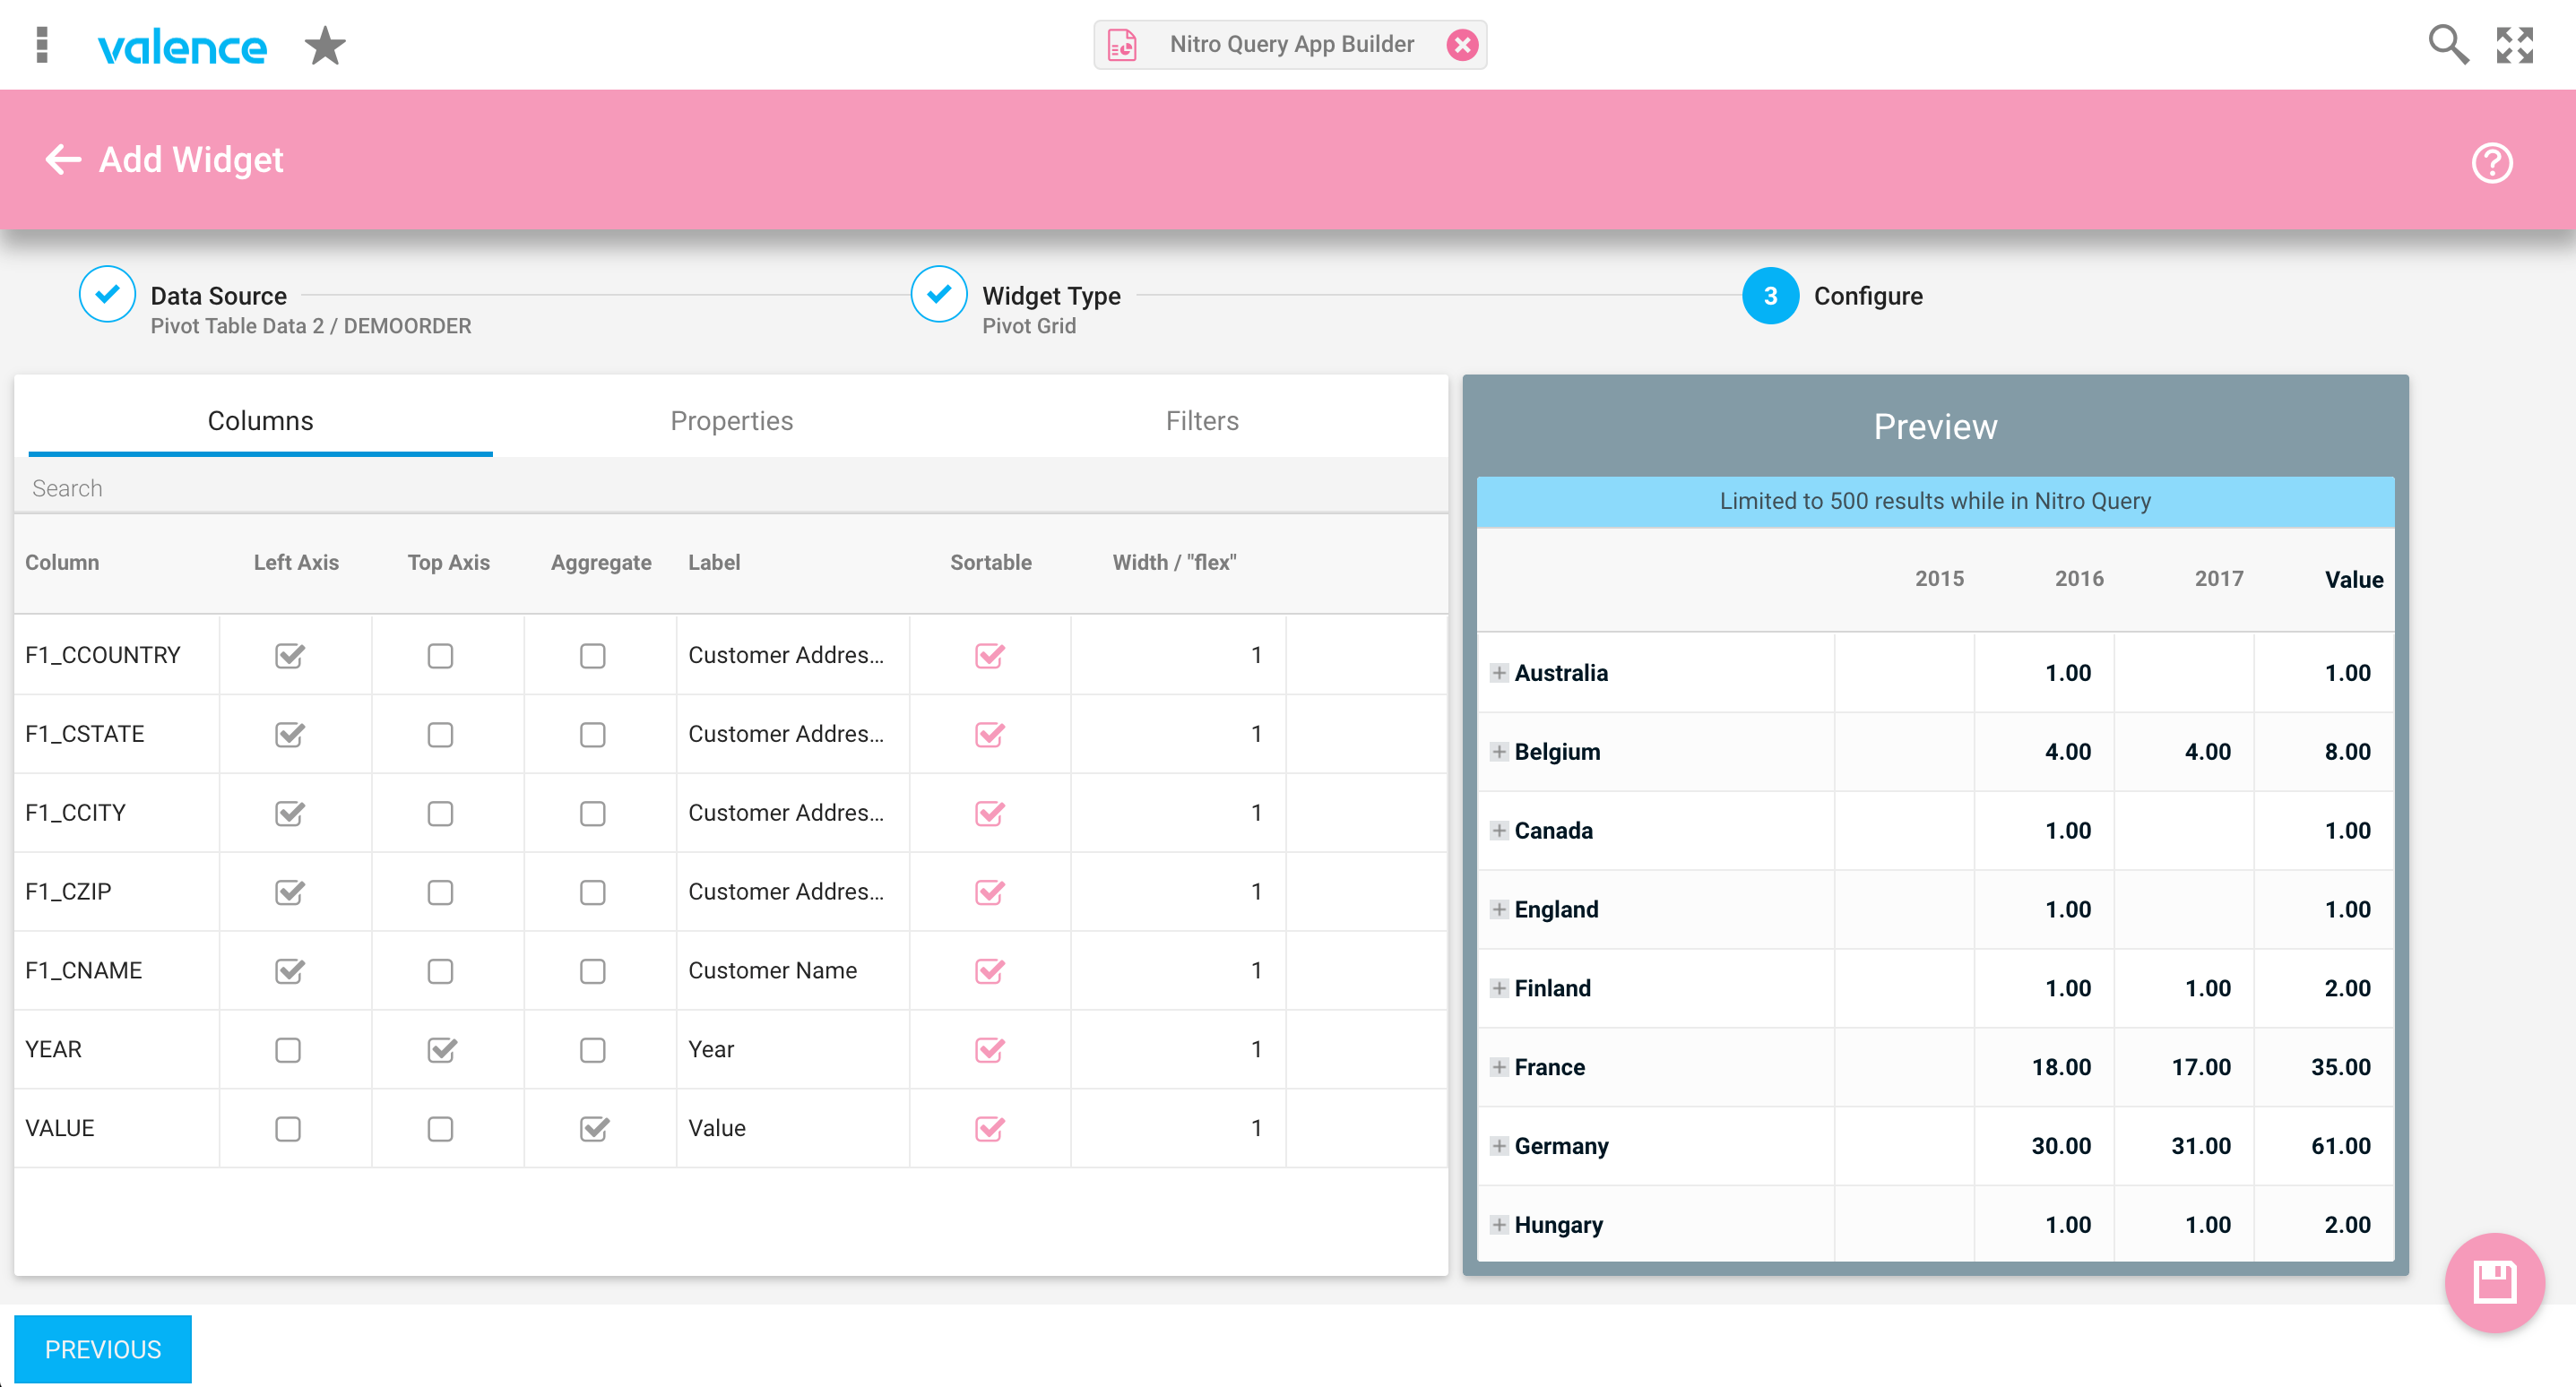
Notice how the numbers in the preview tab look suspiciously whole? That’s because by default the aggregate column is set up as a count rather than as a sum — so in the preview we’re seeing a total count for each entity rather than a summation. Since we want the VALUE column to be treated as a total dollar amount, hover your mouse over the format column — the empty column to the right of “Width / “flex” — and you’ll see “COUNT” show up.
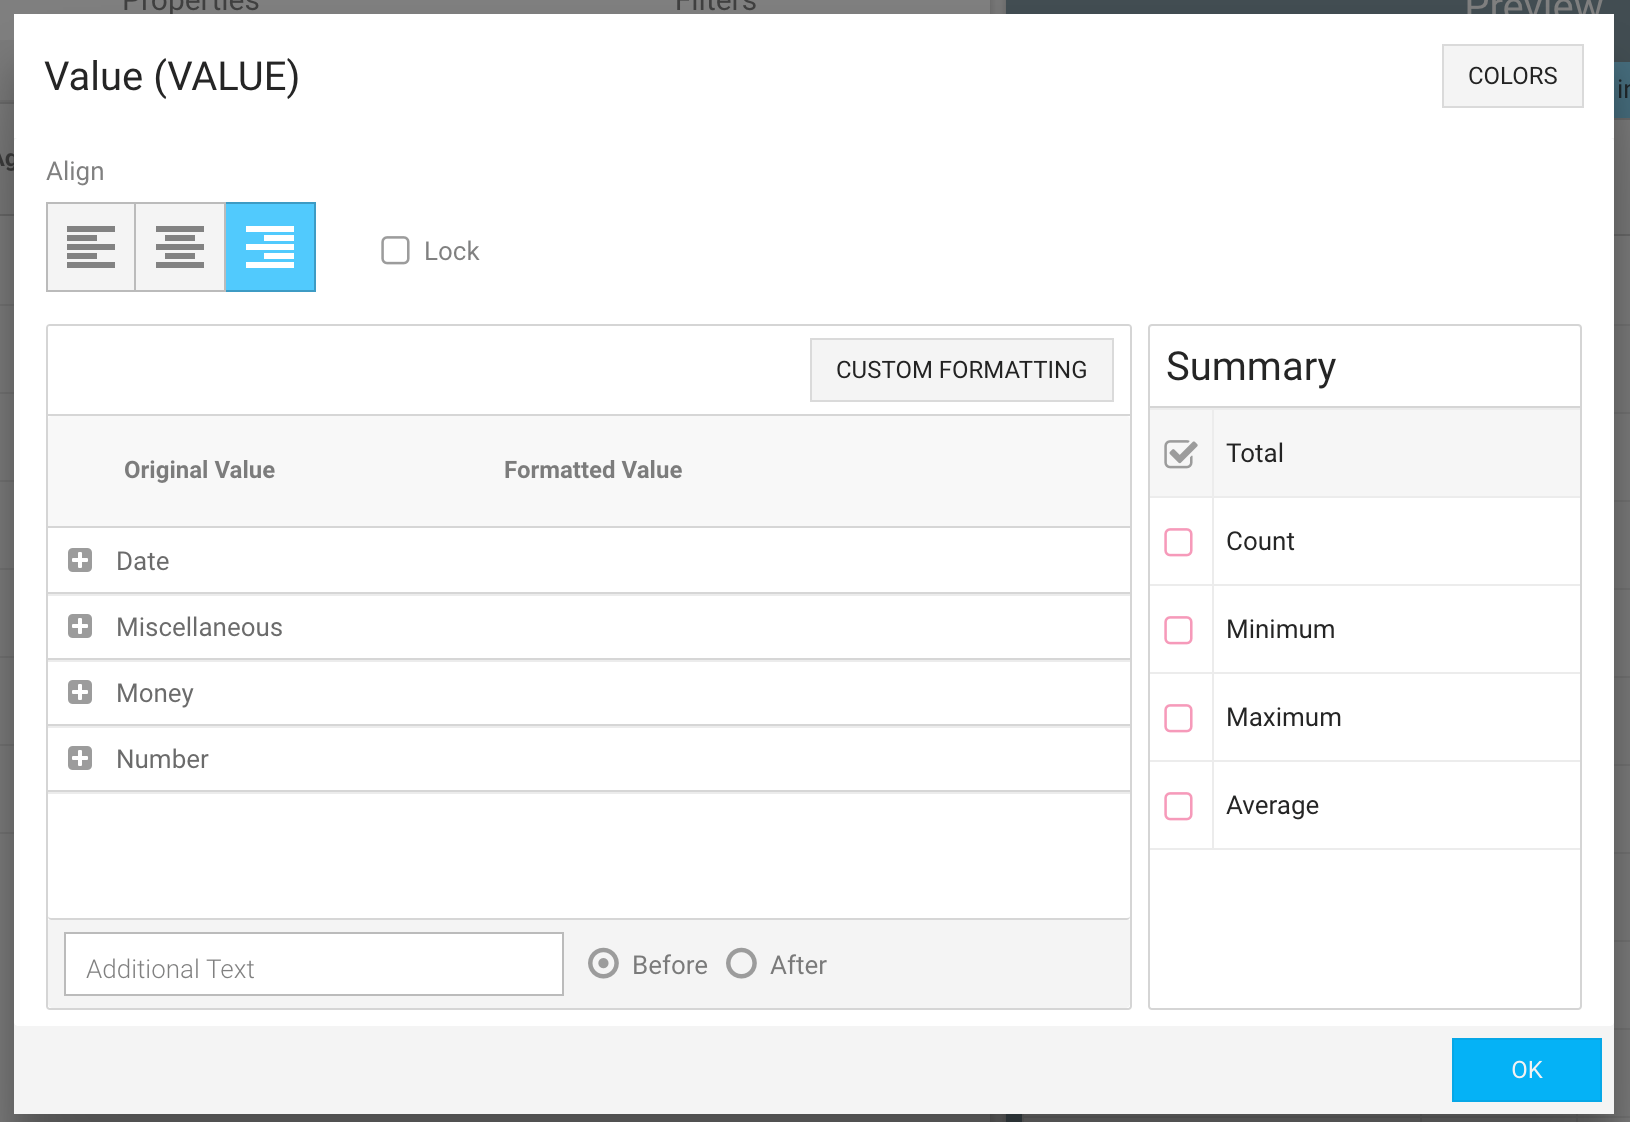
Click on that to bring up the column formatting window shown below, which is similar to the column formatting window you see on conventional grid widgets. Switch the Summary function from Count to Total, then click OK.
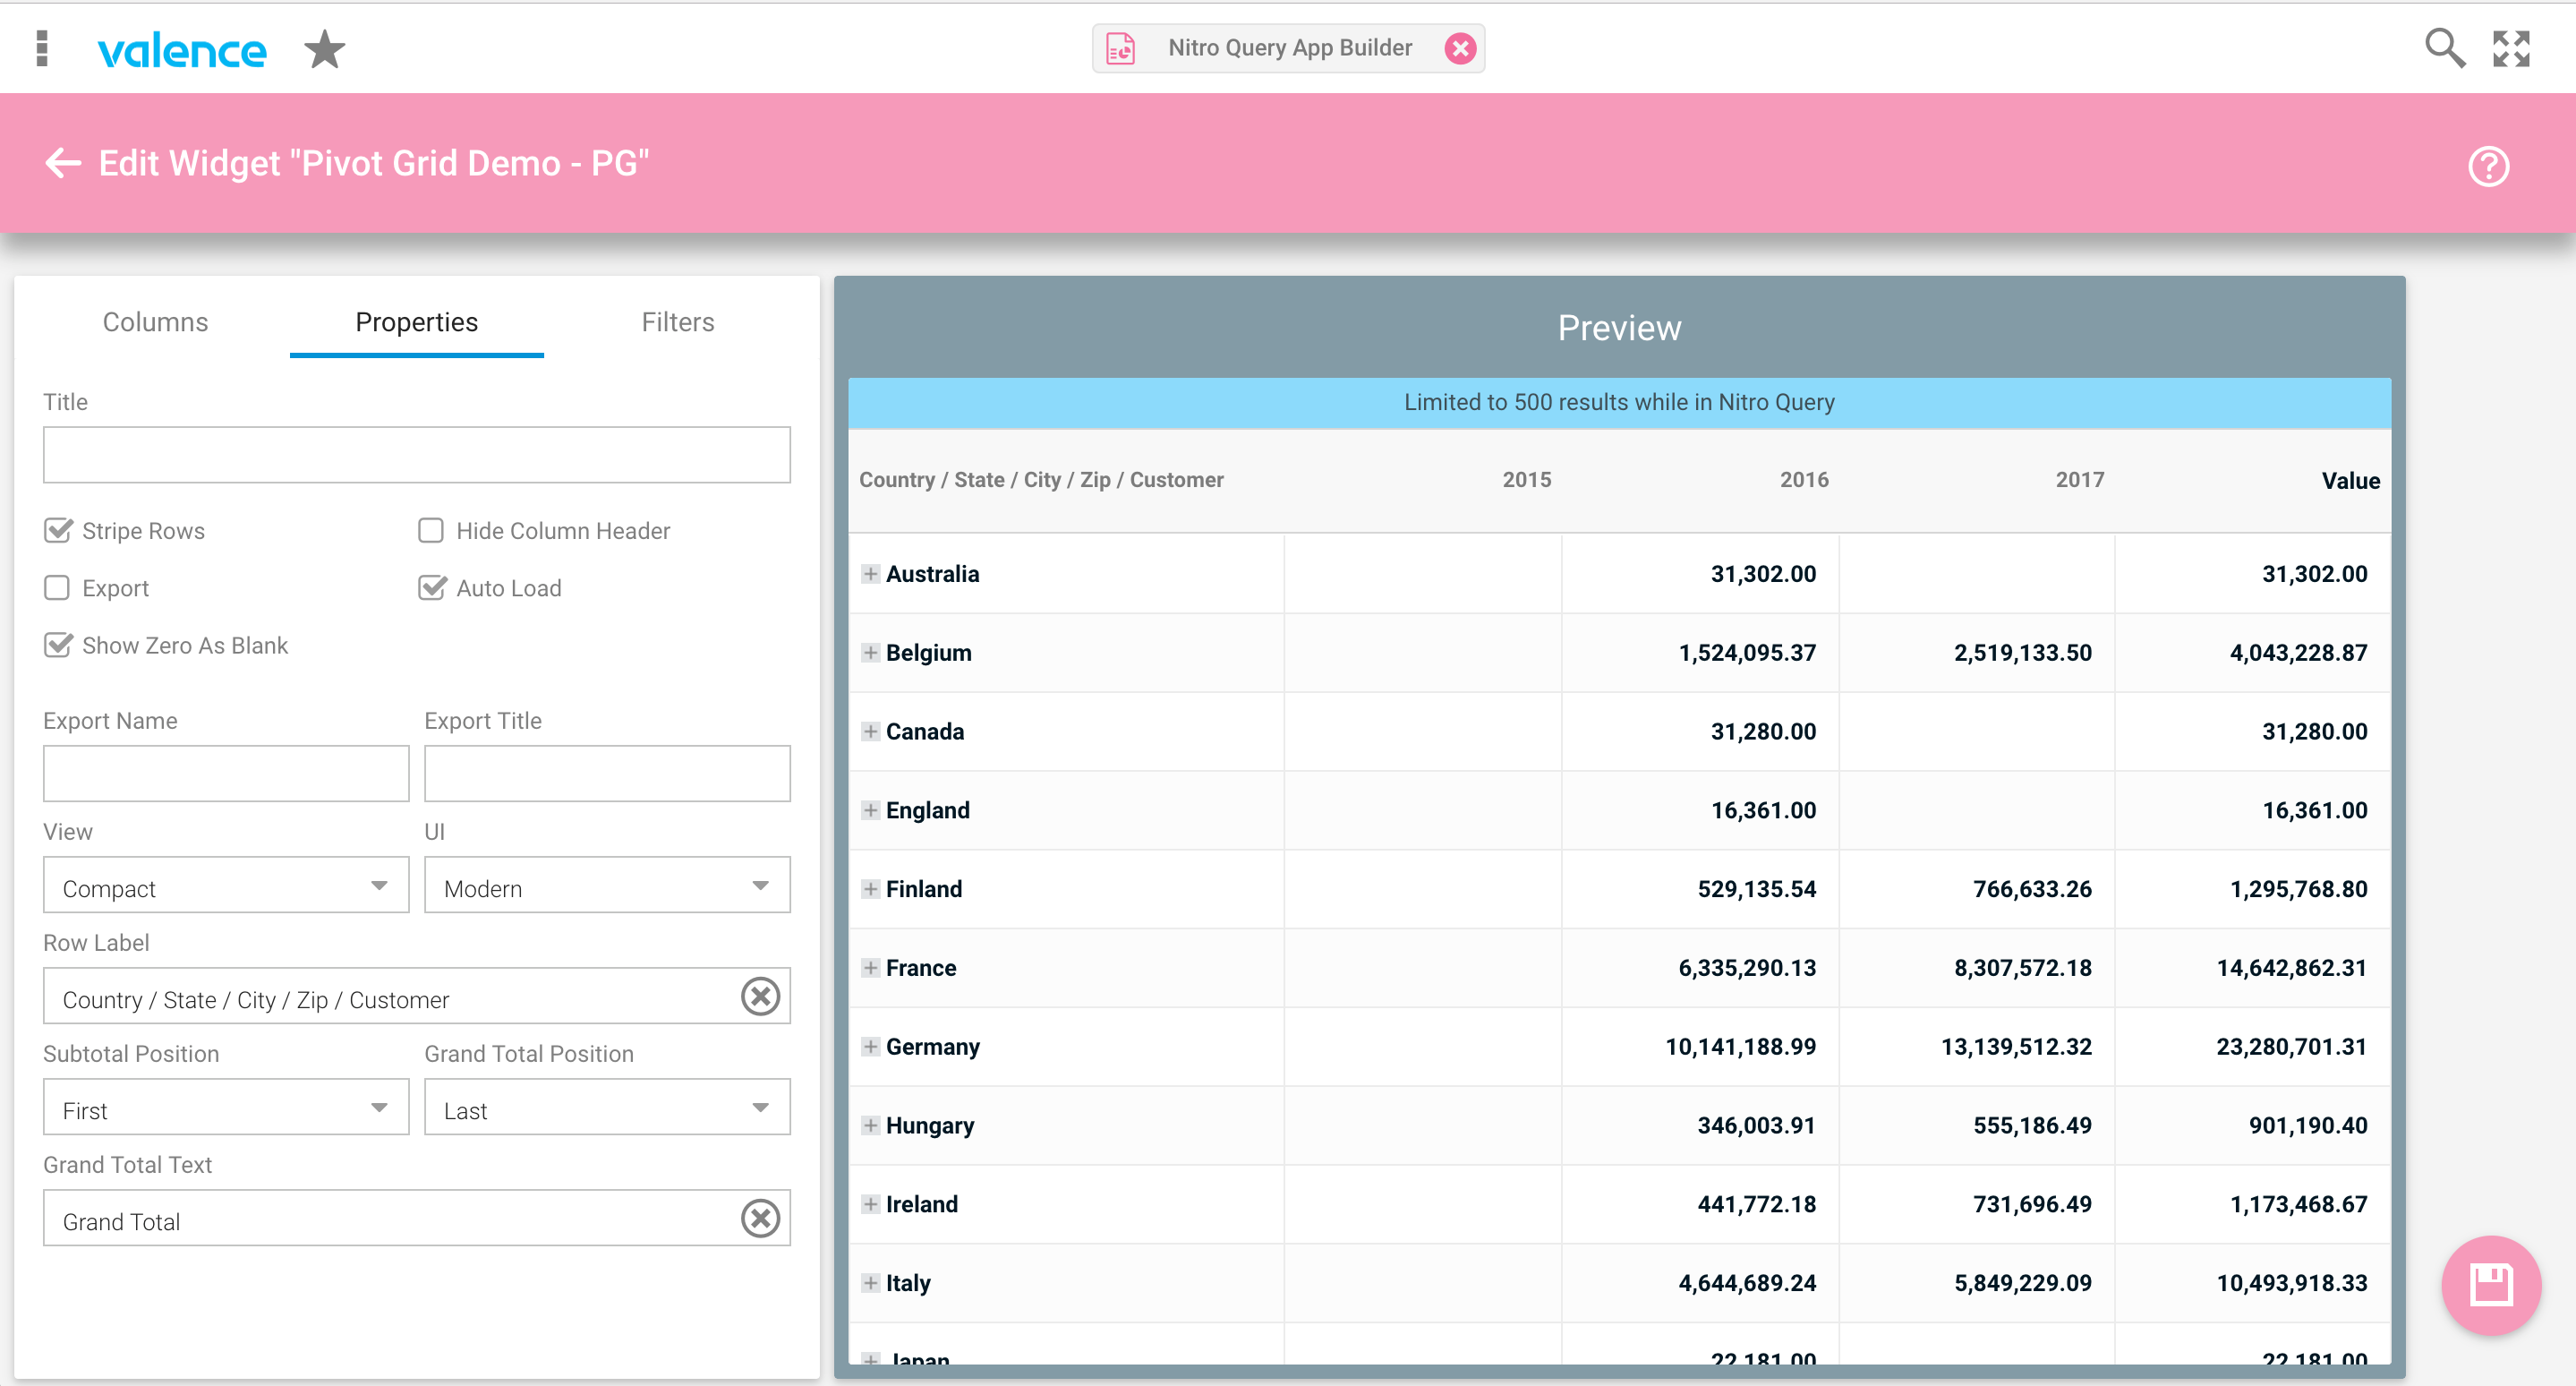
Now let’s move to the Properties tab. There are many things we can configure here, but for sake of simplicity let’s just limit our adjustments to giving the expandable pivot column a column heading that will correspond to the data below it. So in the Row Label field, enter “Country / State / City / Zip / Customer”. You should now see something like this:
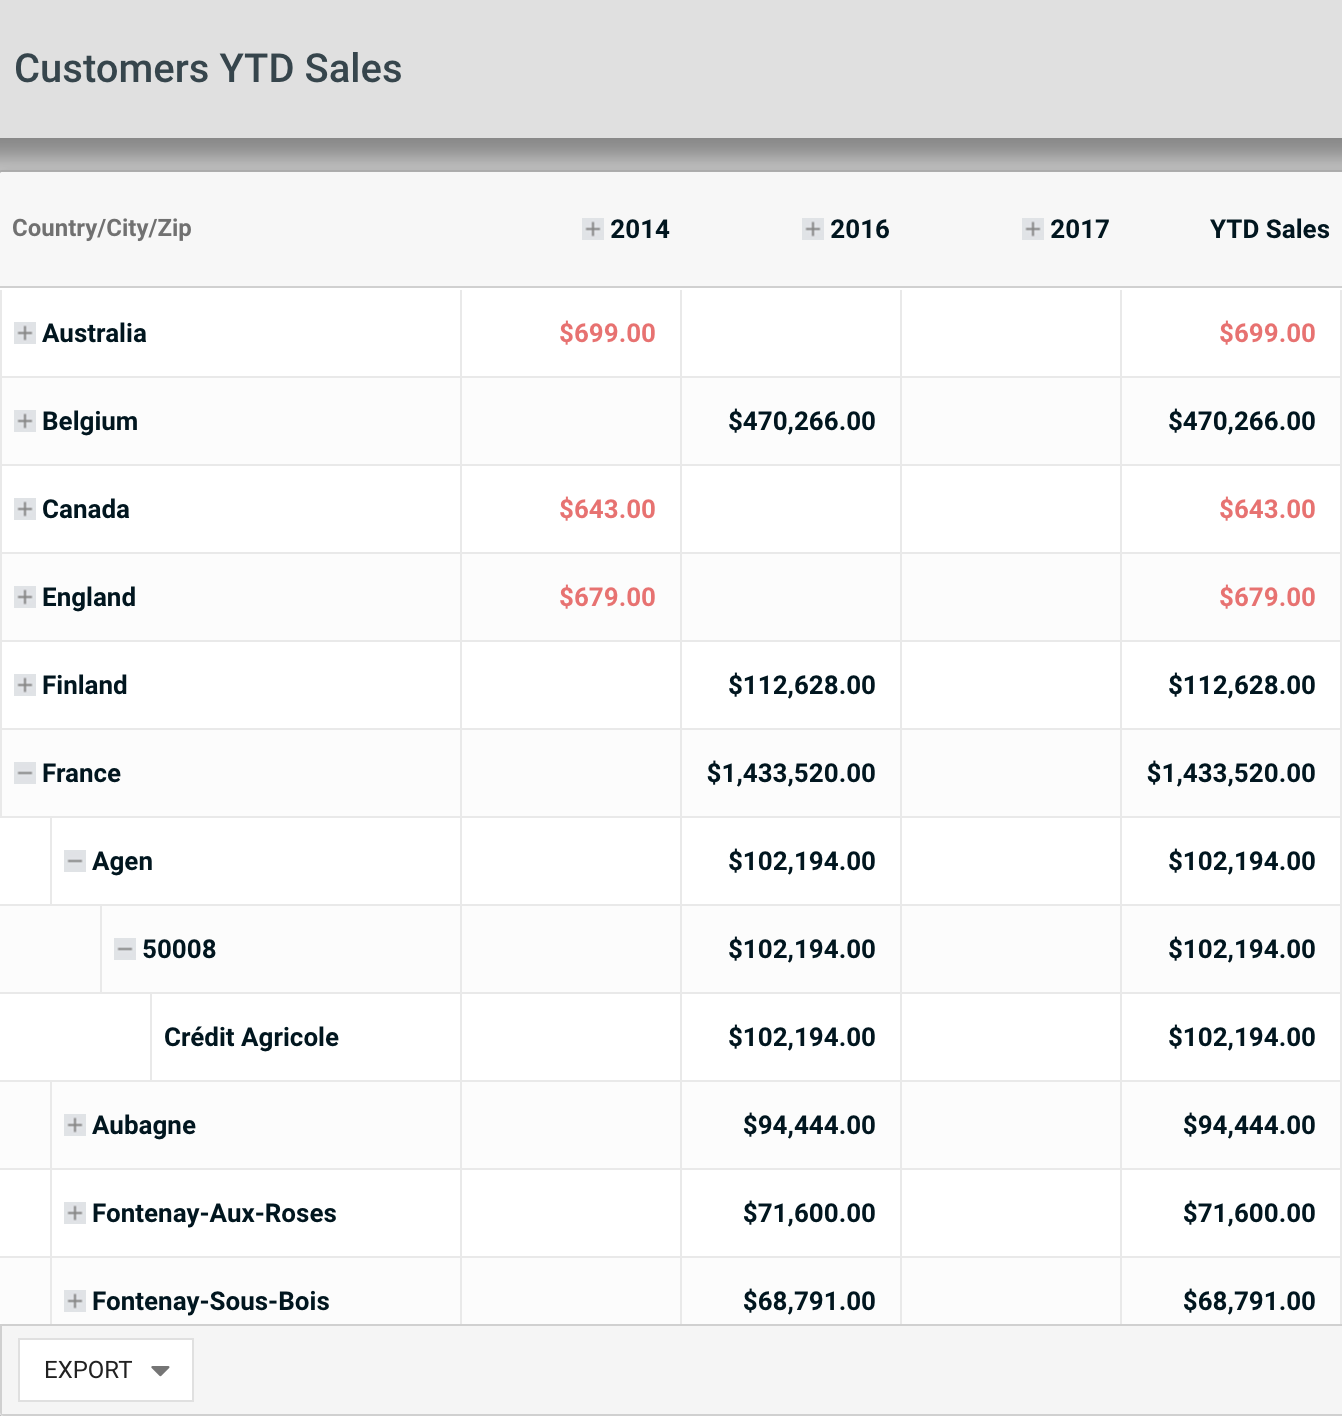
Click the Save button and give your Pivot Grid widget a name. The final step is to simply pop your newly created widget into a Query App and save it so your users can launch it. So within the Nitro Query App Builder app, select the “Queries” tab at the top right, then hit the plus icon to create a new Query. Click on Add Widget, locate the Pivot Grid widget you just saved and click on it. While we could add some more bells and whistles at this point, such as adding row clicks to generate pop up window with more details, for sake of simplicity just click the Save icon now, giving your app an appropriate name (i.e., “Customer Sales by Location”). And with that, your new sales Pivot Grid app is ready to roll! Find the app on your launchpad, launch it and you should see something like this:
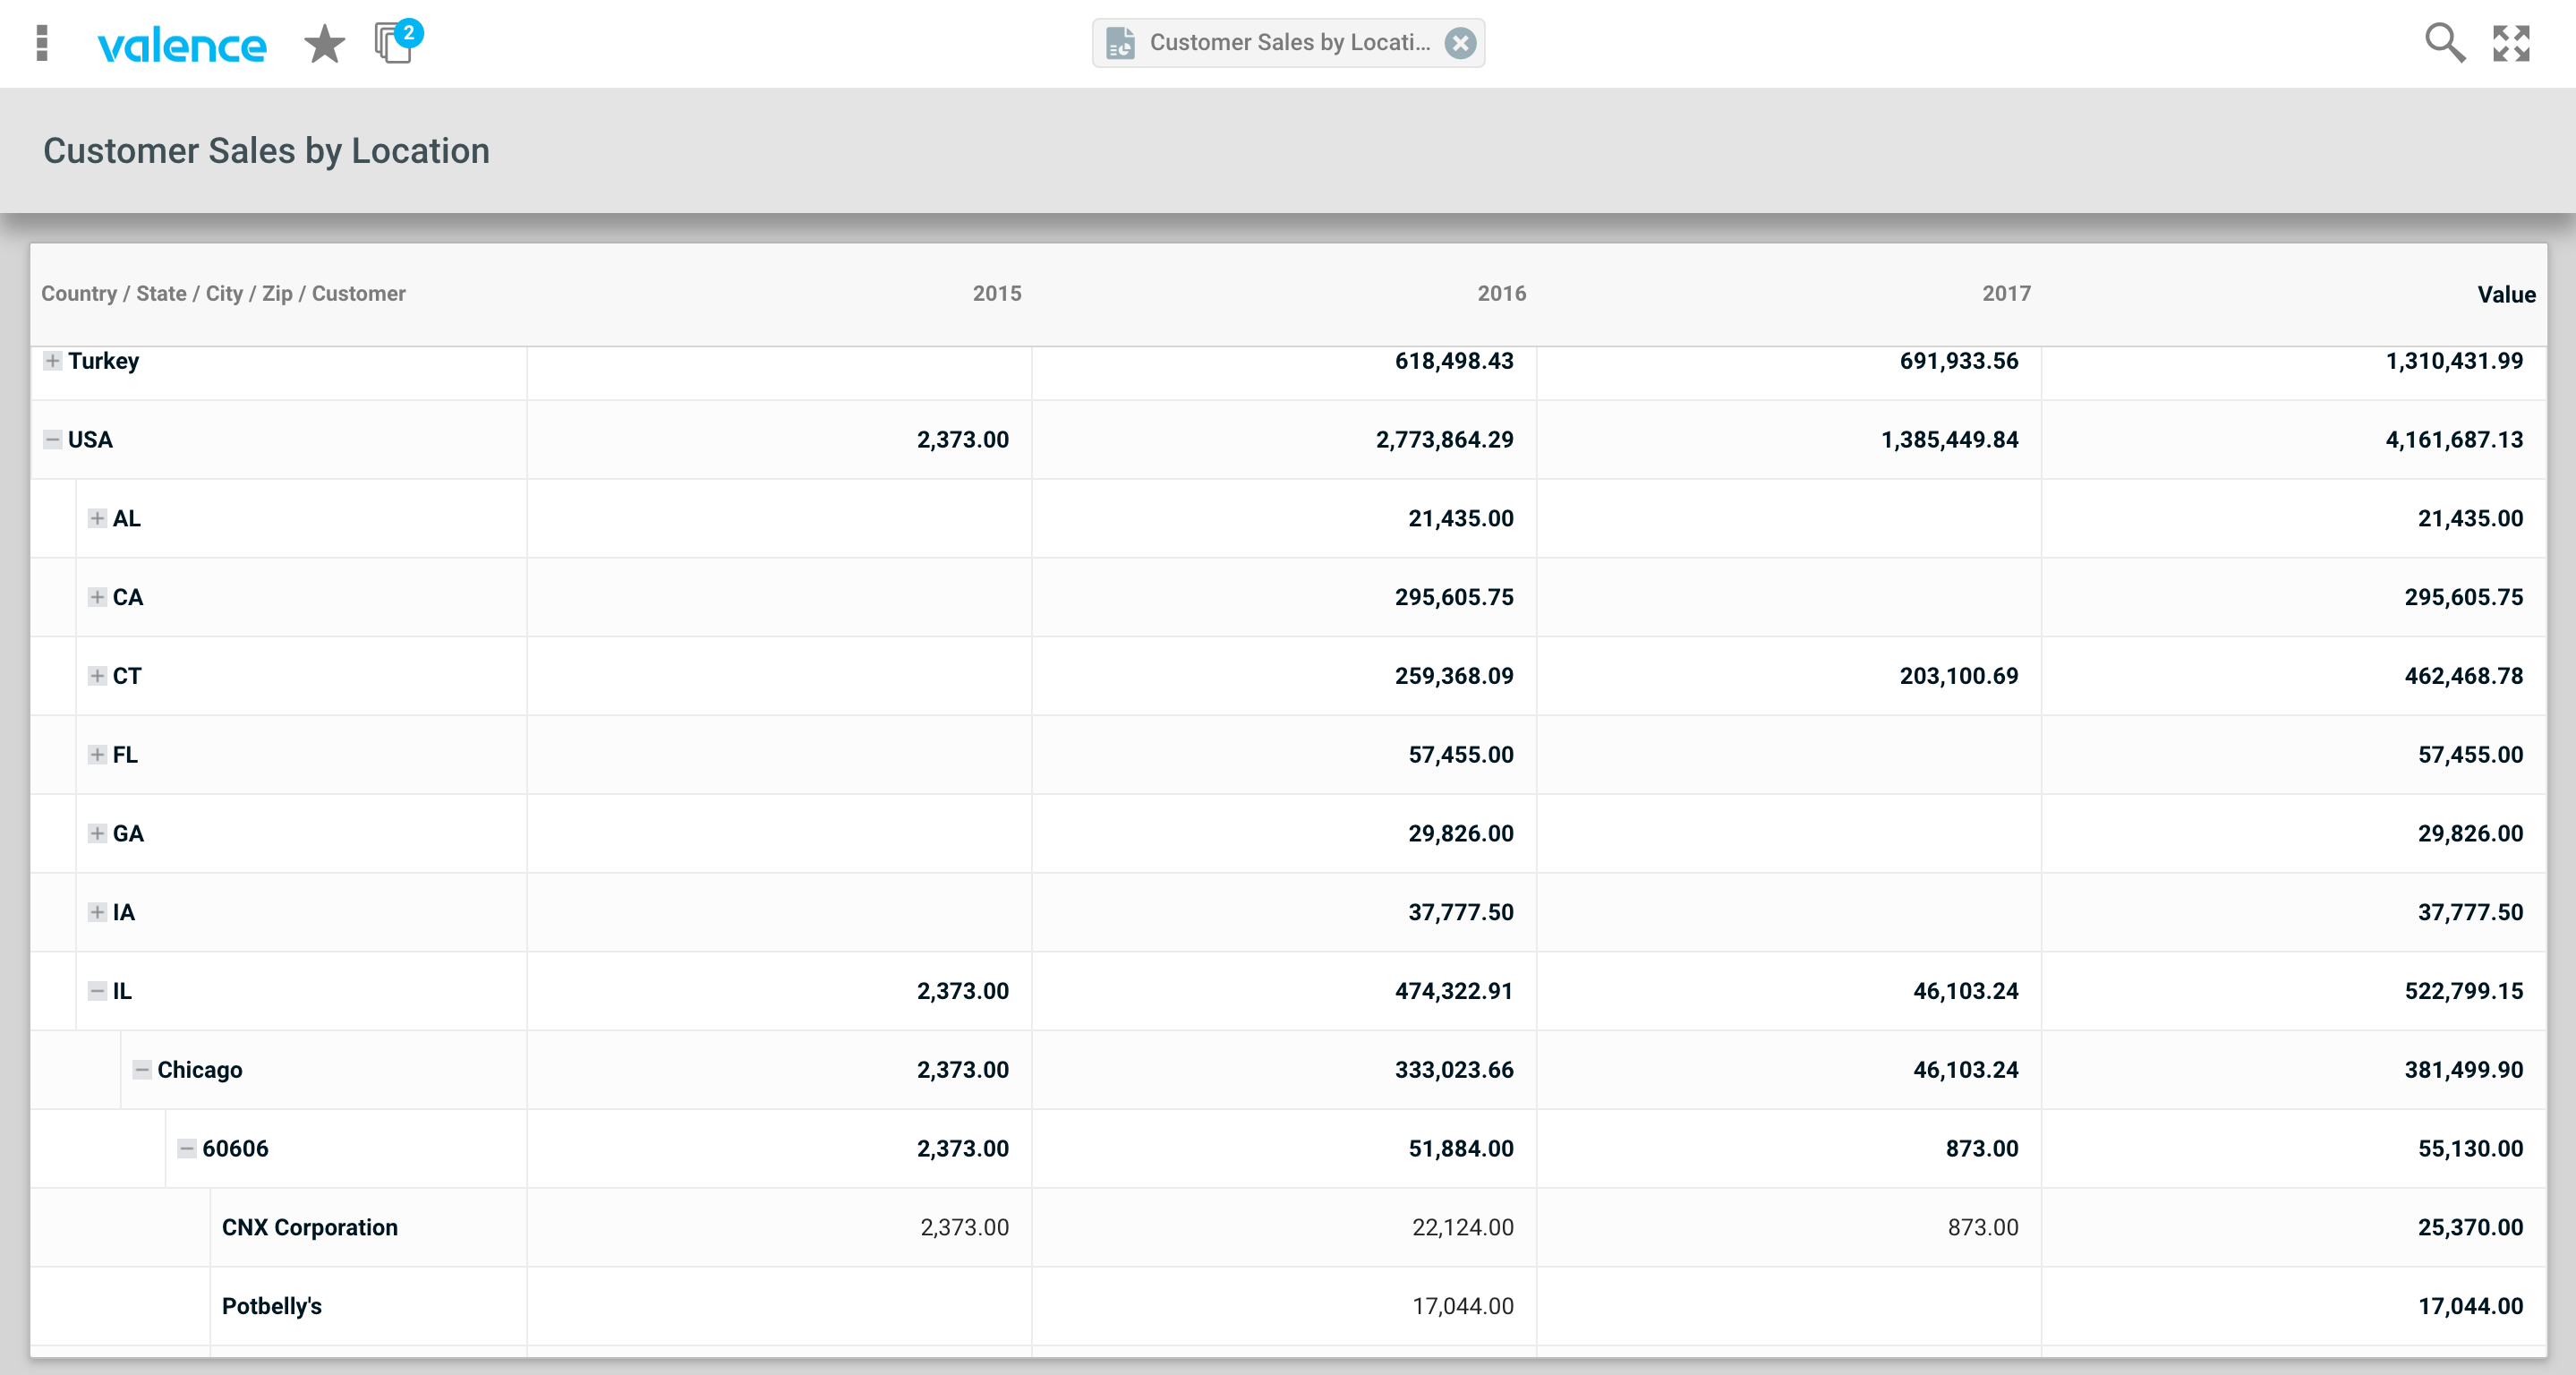
Now imagine the kind of Pivot Grid-based apps you could build over your own customer order files!