One of the more important elements to keeping your users happy is ensuring the apps with which they regularly interact are performing snappily. As discussed in a previous blog post, users can become impatient or distracted when it takes too long to get to the data they need to do their jobs. So it’s critical that developers stay on top of these performance issues as much as possible.

To aid in this endeavor, Valence includes a number of logging options that can greatly simplify the process of (1) figuring out why certain apps are taking longer than expected to run, particularly where SQL is involved, and (2) understanding why apps are returning particular values in response to specific user requests. When used in conjunction with the Portal Admin Log Viewer in Valence 6.1, these logging functions make it easy to understand what’s happening behind-the-scenes on your deployed apps.
Controlling what goes into the logs automatically
Within Valence you can activate and control logging for calls made from to the browser to the Valence instance, responses sent from the Valence instance back to the browser, and for activities that take place between those two events. The logging features are all controlled via Portal Admin > Settings > Log Settings.
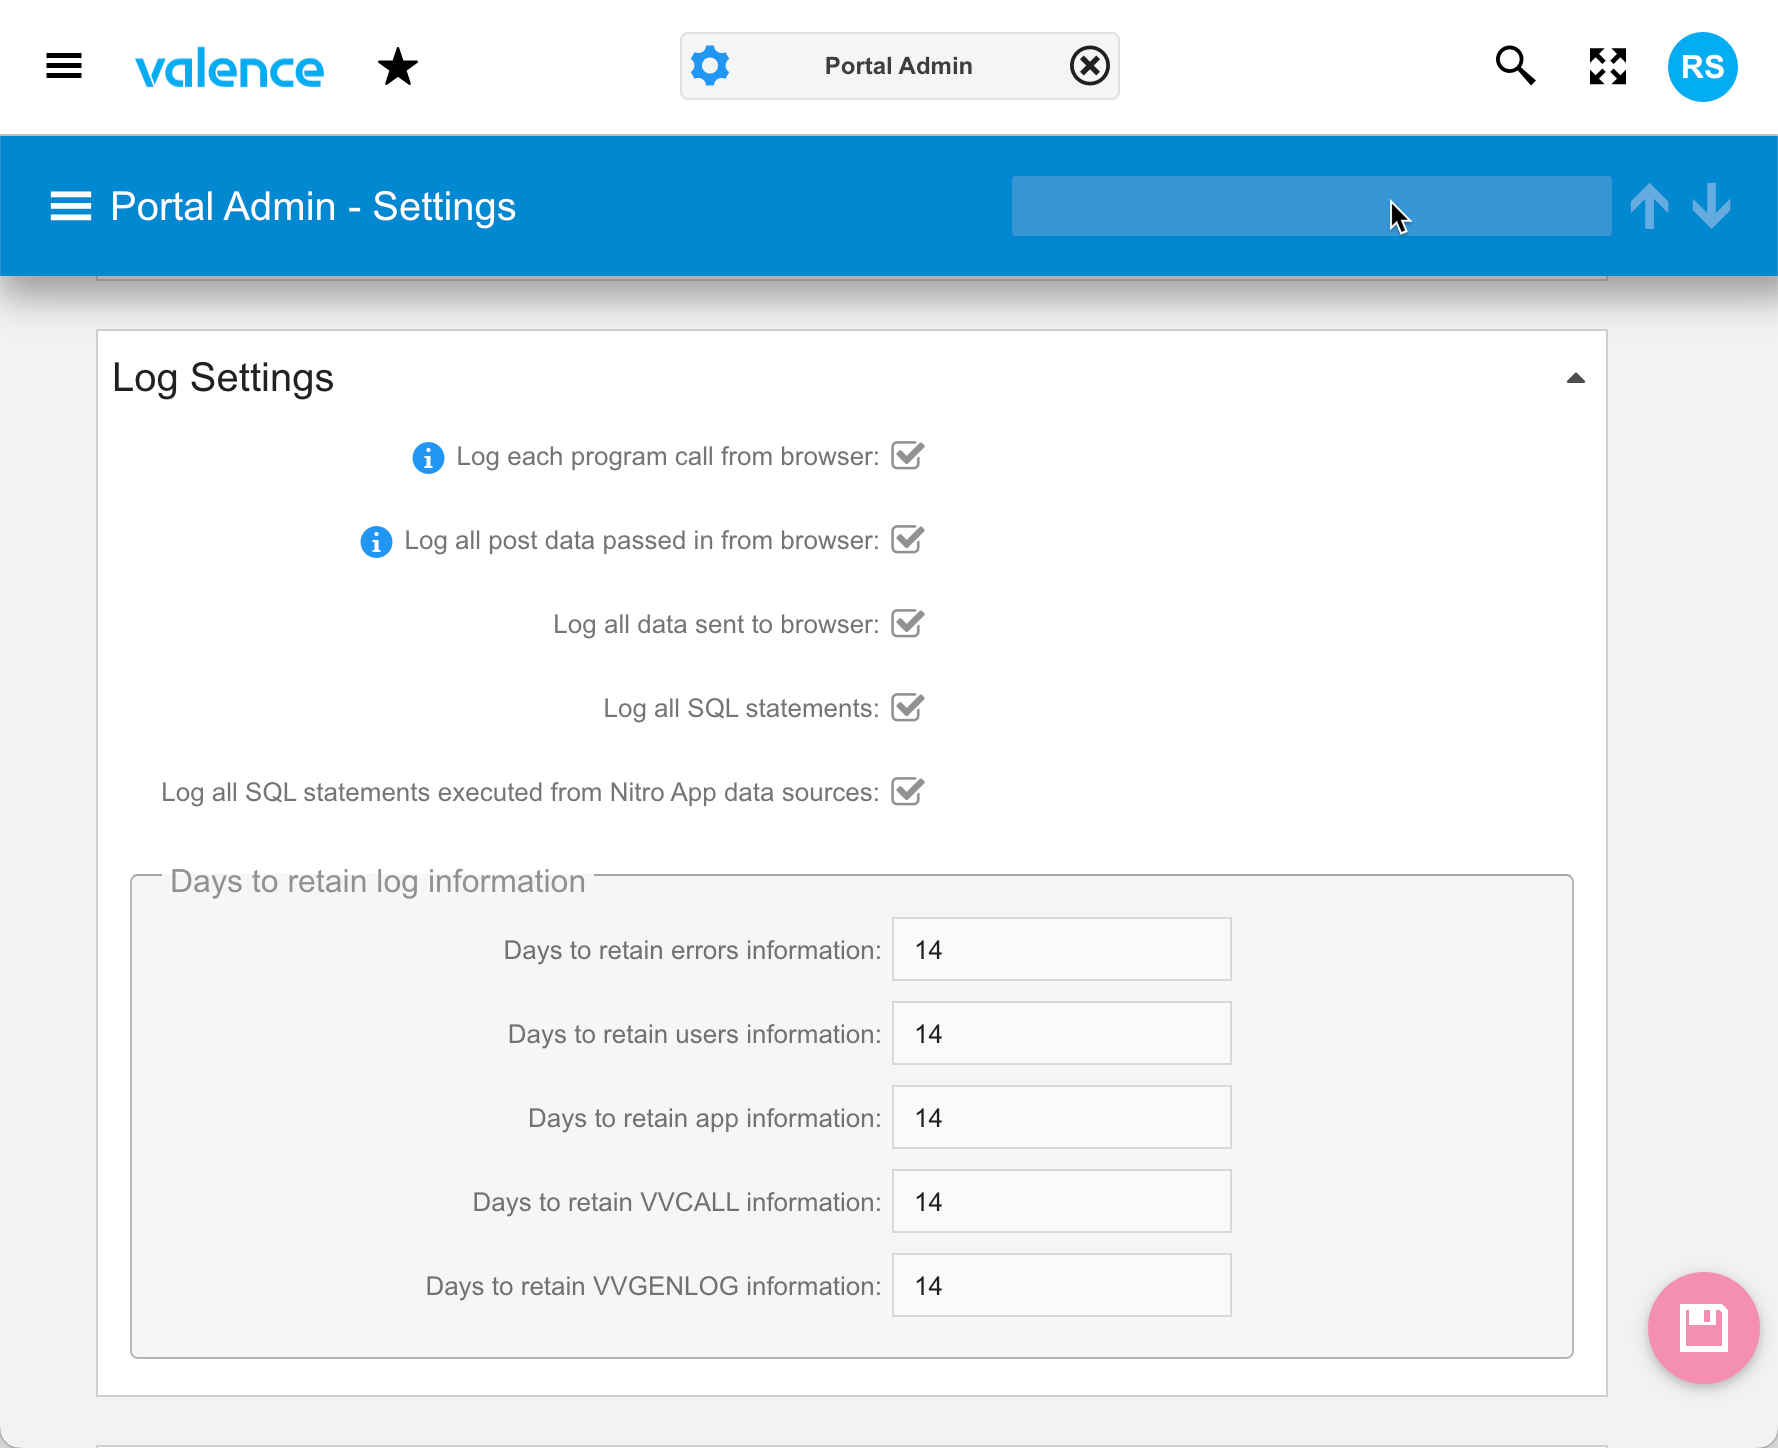
Let’s expand on each of these log settings a bit…
- Log each program call from browser: When this is checked, for each AJAX call made to the IBM i server in this Valence instance, a record is written to a call log table called VVCALLLOG that includes a timestamp of when the call was made, who made it, what they called, and how long the call took. Though this logging level is off by default, there is very little overhead associated with this simple level of logging, so it’s generally not a bad idea to turn this on.
- Log all post data passed in from browser: When checked, additional information is added to the VVCALLLOG record so you can see all the query parameters passed to the back end (up to 8K characters total). This can be helpful for determining what action the user took in their browser to cause the call to be made, and what was requested. This supplemental logging requires a small amount of additional overhead to pull all the parameters and add them to the log record, but in most cases it’s a negligible time.
- Log all data sent to browser: When checked, all data returned from the back-end to the user’s browser (up to a maximum of 24K characters) is added to the VVCALLLOG record. Since responses to AJAX calls can sometimes get rather large, particularly on calls that return multiple rows of data for grids, this level of logging can quickly use up a lot of disk space if you have a lot of active users hitting data-heavy apps. So while seeing response data to individual calls can be helpful, you may want to be a bit more judicious in activating this setting. The log data retention settings (explained in “Limiting the log size” below) can also help mitigate the amount of disk space that is taken up.
- Log all SQL statements: When checked, any programs that invoke any of the Valence back-end RPG toolkit procedures to send SQL results to the browser (specifically, vvOut_execSQLtoJSON, vvOut_execSQLtoSS and vvOut_execSQLtoCSV) will log the SQL statement to the Valence general logging file, VVGENLOG, unless explicitly set not to via vvOut.logStmt=’0′. Each record includes the SQL statement executed, when and who ran it, the IBM i job number that processed it, and the time it took to complete the execution. This setting also causes any database updates/deletes/adds triggered from either a NAB app or the Nitro File Editor app to be written as well.
- Log all statements executed from Nitro App data sources: When checked, any NAB app pulling data via SQL will trigger a VVGENLOG log record to be written. This can be extremely helpful for tracking down long-running SQL statements and finding ways to speed them up, i.e. by altering the statement or adding indexes/logical files to your system.
All logging is turned off by default when you first install Valence, so as not to adversely affect performance or disk utilization on smaller or less powerful systems. But on most newer or higher-powered systems, activating logging does not typically have a noticeable impact on performance. Nonetheless, you should turn on these features with discretion depending on your own system configuration.
Manually adding log data from RPG
In addition to the automatic logging controlled by these settings, your custom RPG programs can also write data to the VVGENLOG file via the vvUtility_Log procedure. This can be helpful for debugging or merely logging when certain lines of code are executing within your various programs. An example of writing a log record from an RPG program might look like this:
vvUtility_log('1':'Saving data for order number '+%char(ordno));
We’ll see in a moment how log messages like this can be viewed in conjunction with calls made from the browser.
Limiting the log size
While log data can be extremely useful, too much log data can become a problem if disk space on your system is tight. Valence will automatically delete older log records after a certain amount of time elapses based on the “Days to retain log information” settings as follows:
- Days to retain errors information – refers to data stored in file VVERRLOG, which holds any exceptions that occur in any of the RPG toolkit procedures. This data is visible in the Errors app.
- Days to retain users information – refers to data stored in file VVUSRLOG, which holds login/logout data for all user sessions. You can use Nitro File Editor to view this data.
- Days to retain app information – refers to data stored in file VVAPPLOG, which holds information about which apps users are launching. This data is used in the App Usage app. Since the VVAPPLOG records are relatively small, some sites expand this setting to a much longer purge period like two years (730 days).
- Days to retain VVCALL information – refers to data stored in the VVCALLLOG file explained earlier. This file can get quite large in short order, particularly when including back-end response data, which can eat up to 24K per call. Hence it may be advisable to keep this setting to the default of 14 days, or possibly even less for very active instances.
- Days to retain VVGENLOG information – refers to data stored in the VVGENLOG file explained earlier. Since this file is the repository for SQL statements and execution time, which generally aren’t too long, you may wish to extend this retention period beyond the 14 day default if you’re looking to analyze SQL performance in your apps over a longer timeframe.
Analyzing the log contents
And now we get to the “fruit” of all your logging efforts. The Portal Admin app includes a “Logs” tab (accessible via the menu selector in the upper left) which, when selected, presents a list of the latest log data in reverse chronological order:
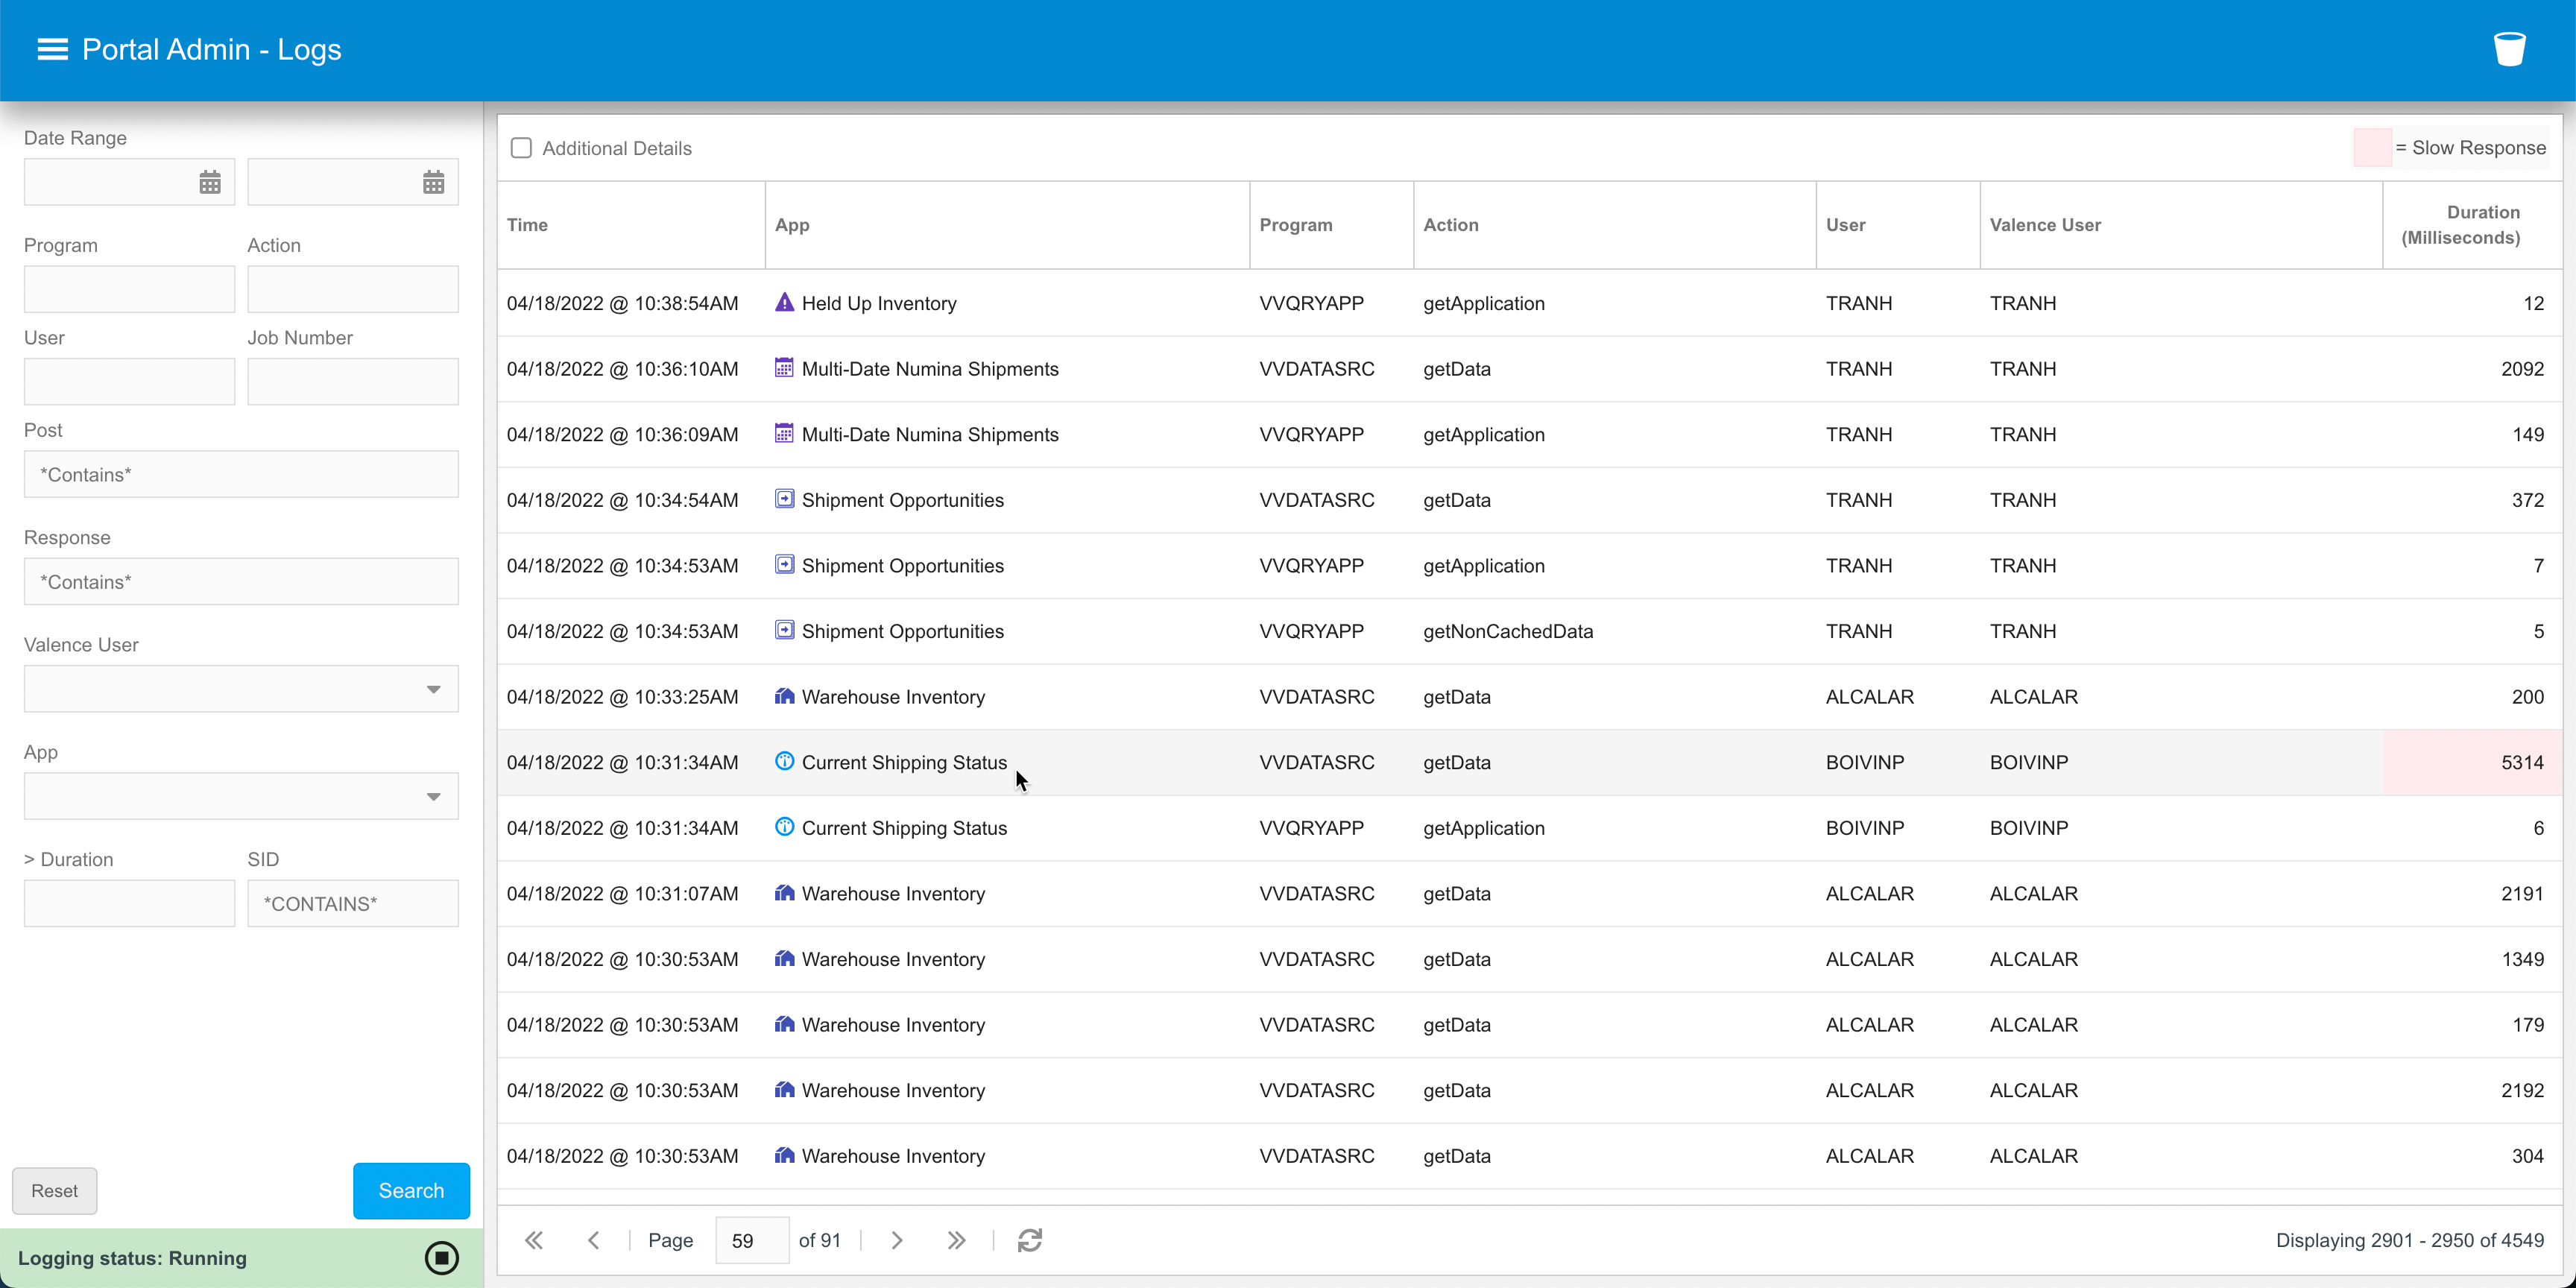
The filters in the left panel can be extremely useful for locating the calls you’re interested in investigating. The filterable elements include:
- Date Range – Limits the list to browser calls placed between the dates specified.
- Program – Limits the list to calls made to a specific RPG program. Note this refers to the program at the top of the call stack; it does not refer to programs subsequently called within that program.
- Action – Limits the list to calls containing this specific “action” query parameter.
- User – Limits the list to calls made under this specific IBM i profile.
- Job Number – Limits the list to calls made to this specific IBM i job number.
- Post – Limits the list to calls containing a query parameter value wholly or partially matching the text specified. Since this is a wildcard (“contains”) type of search, the search time will be improved if you also limit the date range and any other filters in conjunction with this value.
- Response – Limits the list to calls returning a value that wholly or partially matches the text specified. For best performance, this too should be specified in conjunction with other filter values.
- Valence User – Limits the list to calls made under the specified Valence user profile name
- App – Limits the list to calls made from a specific Valence app
- Duration – Limits the list to calls exceeding this number of milliseconds. This can be helpful when looking for program calls that are taking longer than a few seconds to complete (1000 milliseconds = 1 second). Calls taking longer than 2.5 seconds show the duration highlighted in red.
- SID – Limits the list to calls for a certain Valence session ID (SID). Usually the first 5 or 6 characters of the SID is enough to isolate to a specific session.
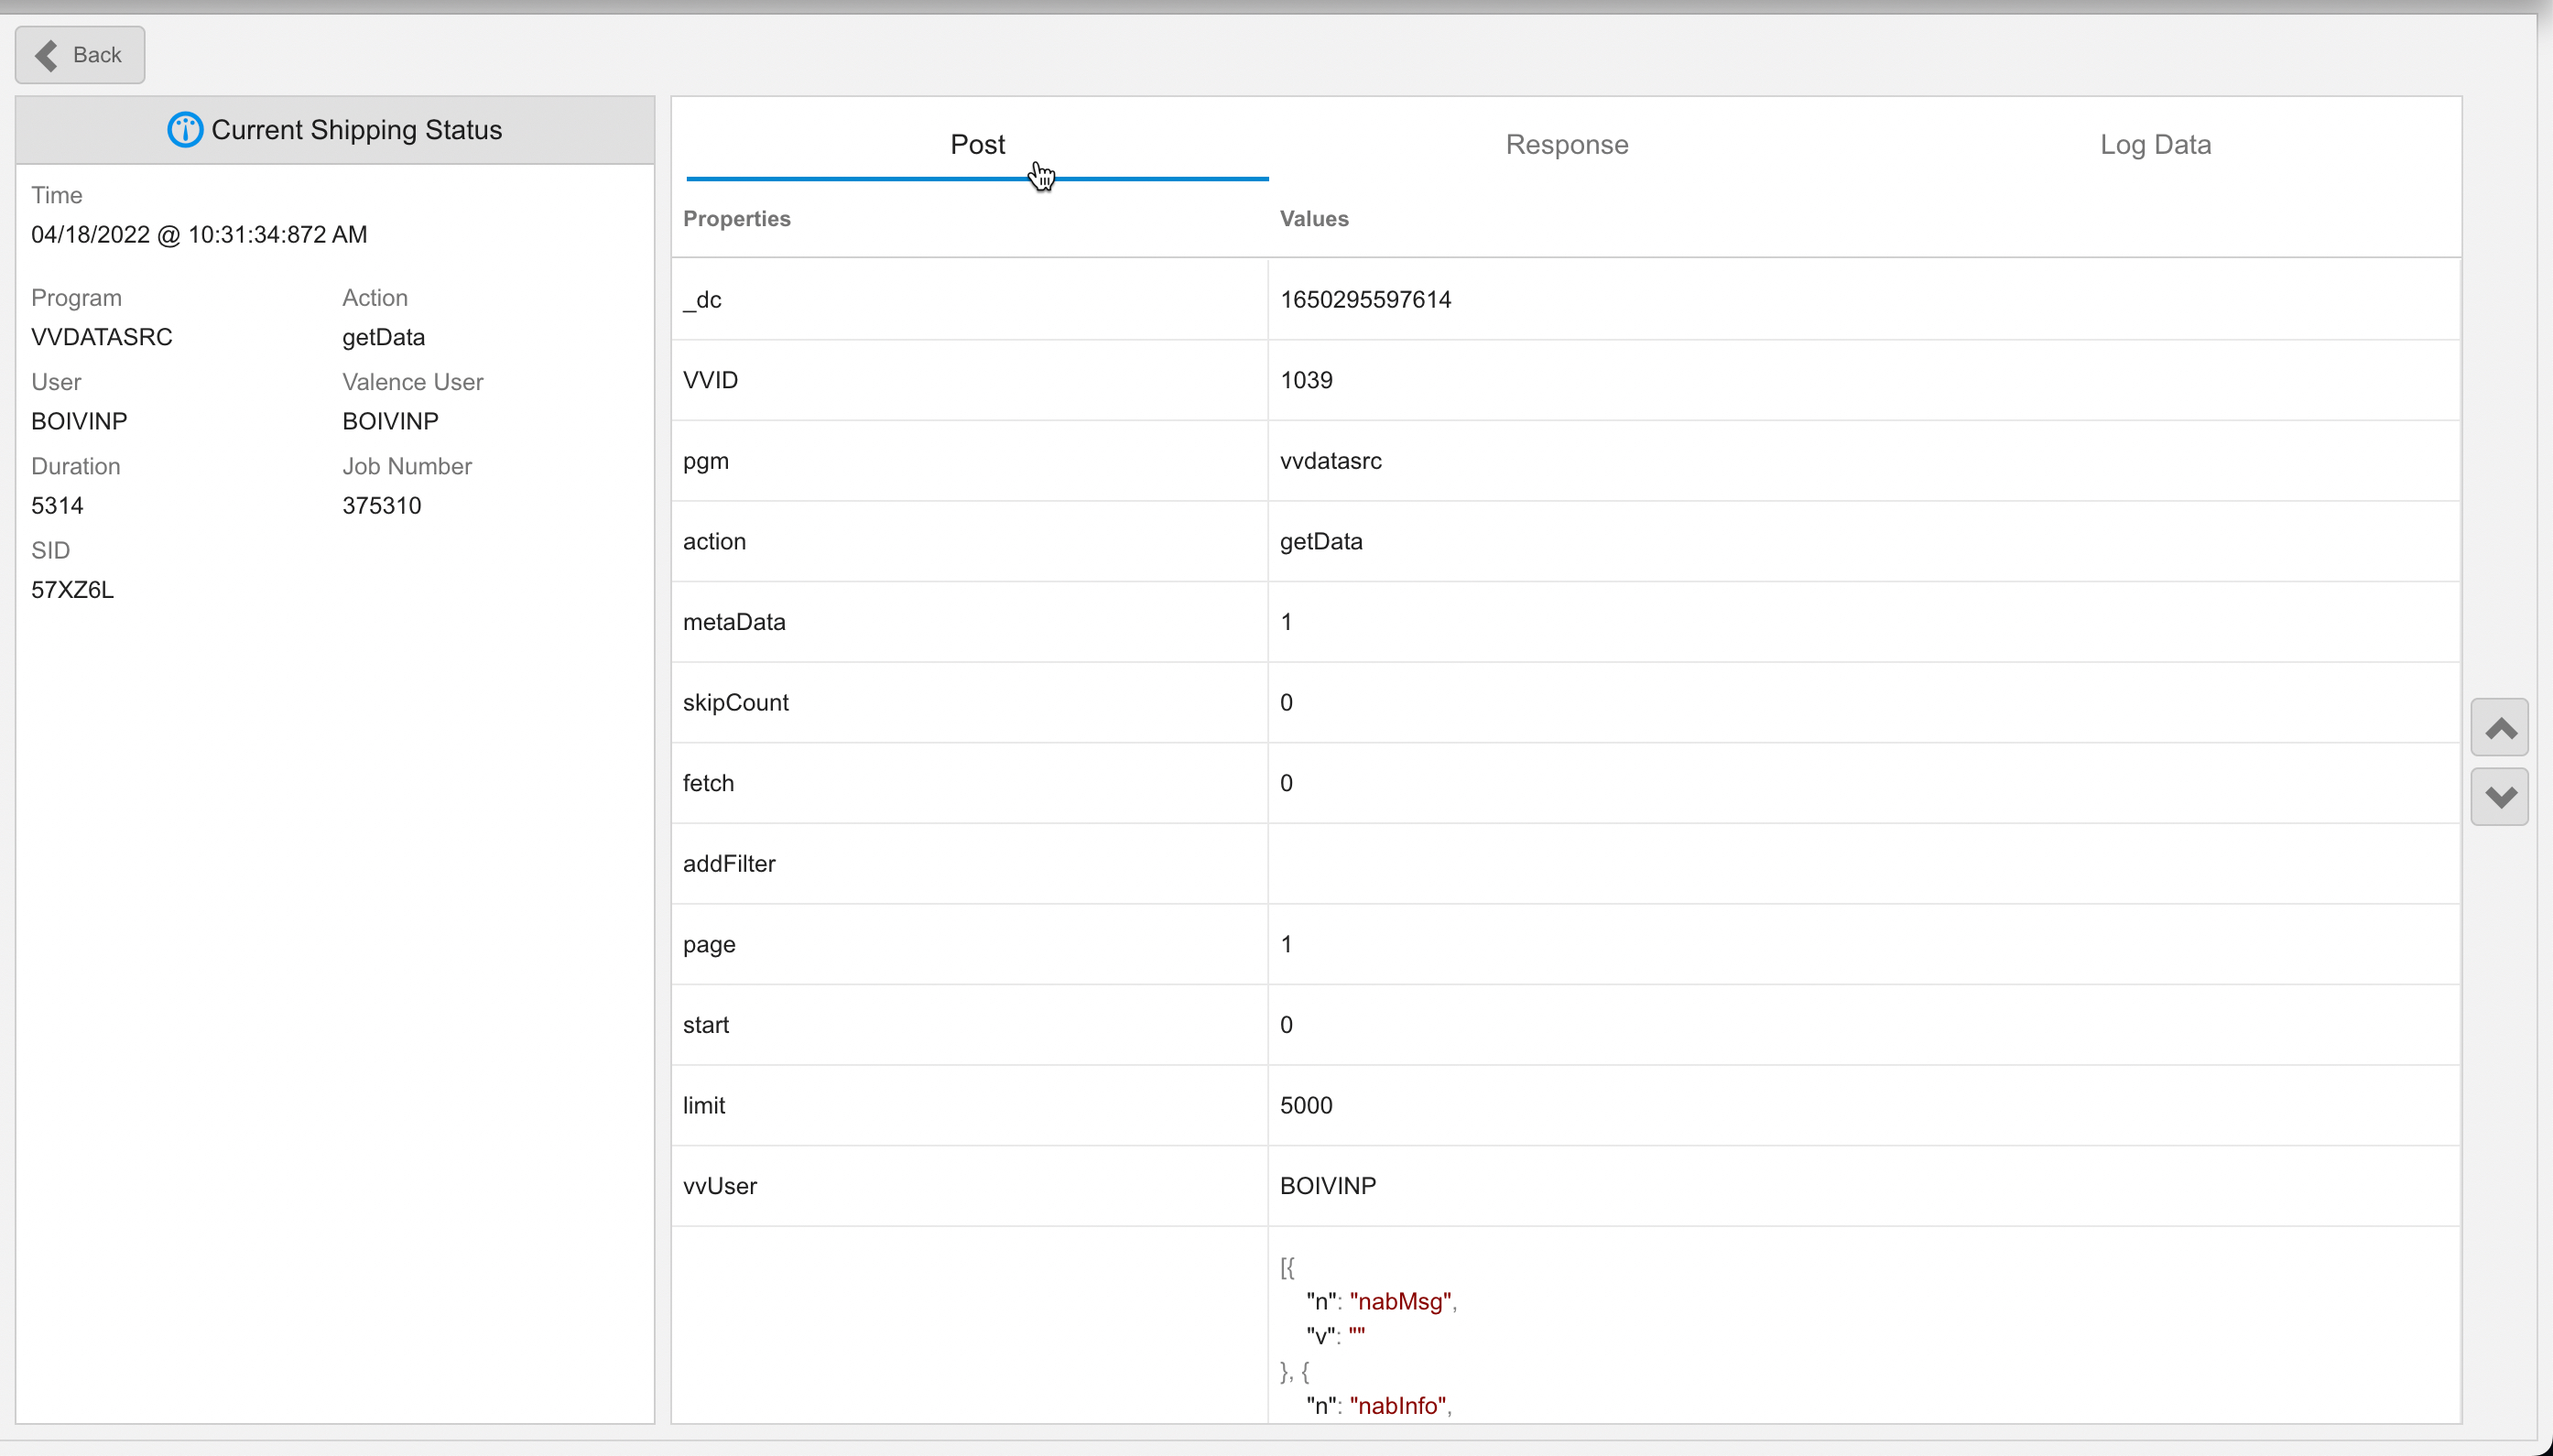
Once you’ve found the program call you’re interested in inspecting, click on the row to see the details. There can be up to three tabs of data. If you’re logging post data, then the first tab (“Post”) lists all the query parameters (up to 8K characters) that were passed:
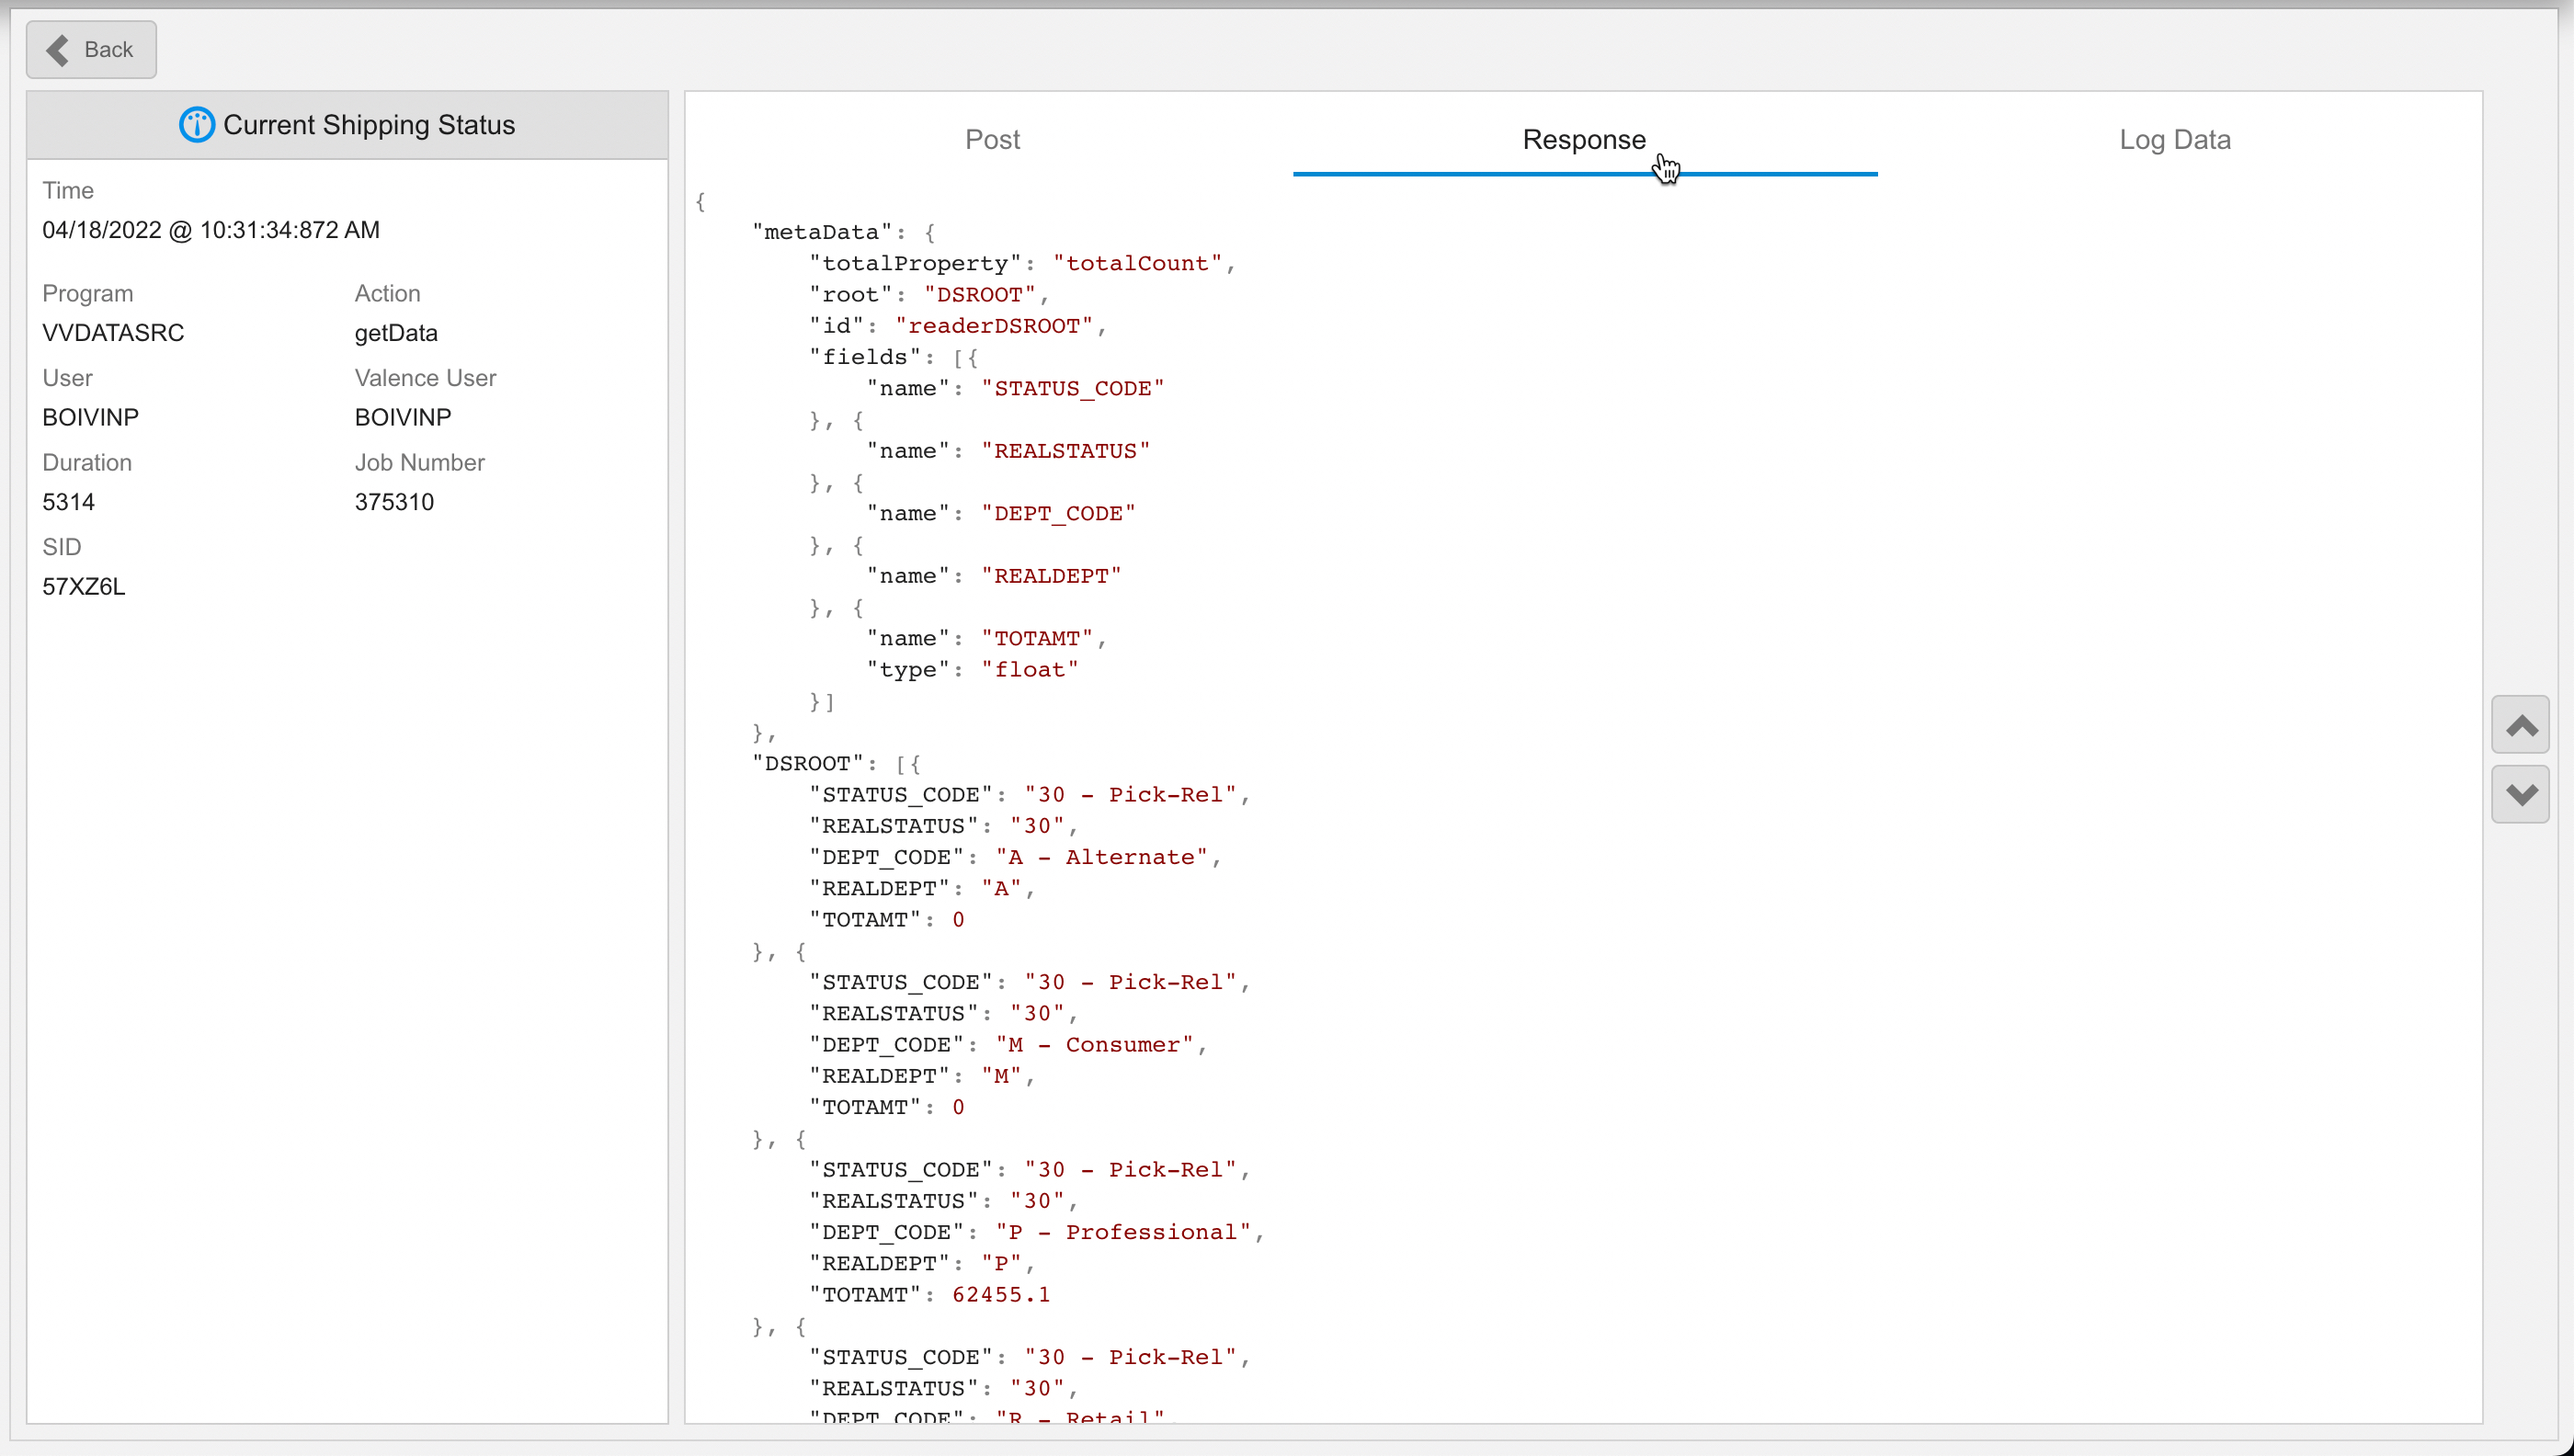
If you’re logging response data, the next tab (“Response”) will show up to 24K of the characters passed back to the browser. For JSON-structured responses, the data is formatted for easier reading:
Finally, and most important to the topic at hand here, is the “Log Data” tab, which will show if any VVGENLOG records were logged during the course of the call. For NAB apps, each time a widget seeks data from the back-end it will log a “getData” call to program VVDATASRC. When SQL logging is activated, each SQL statement will be depicted in this tab, along with the time each statement took to execute:
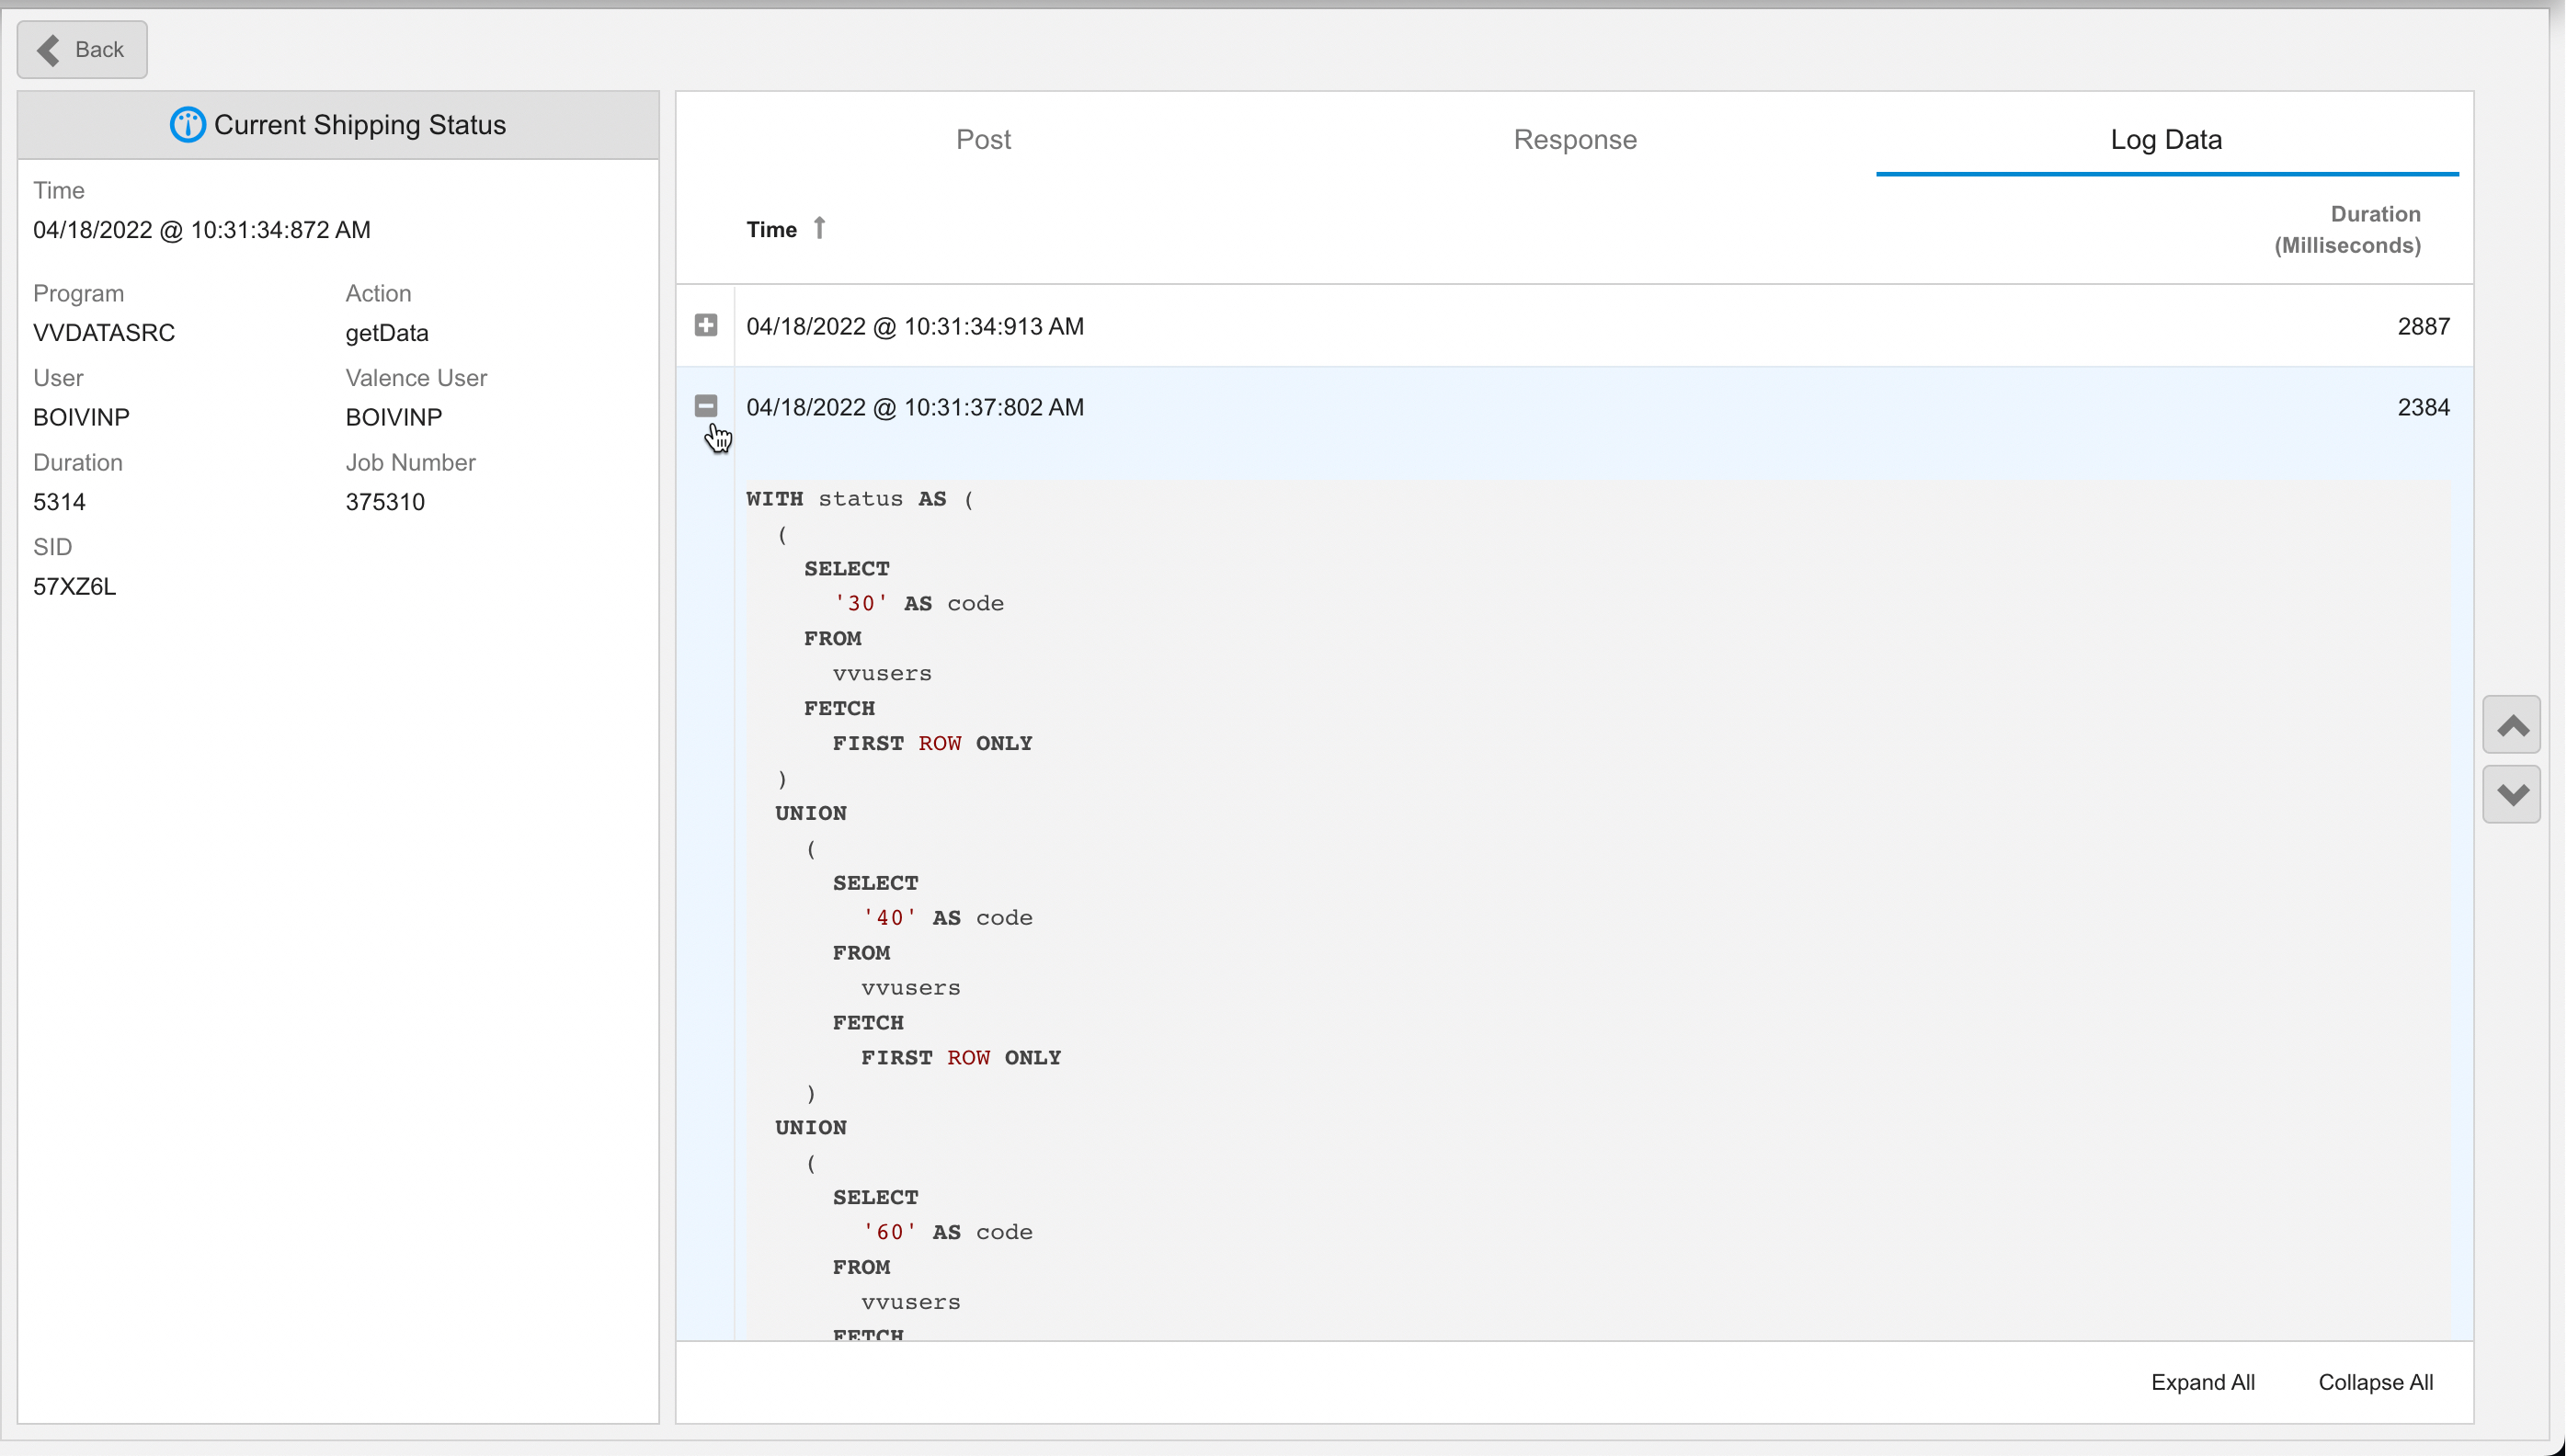
You can copy longer running SQL statements into a tool such as ACS’s Run SQL Scripts to analyze why they’re taking so long to run and either adjust the statement or add indexes to help the SQL engine process the statement faster.