Hard as we may try, it’s almost impossible to guarantee error-free execution of programs after promotion into a live environment. Even with a crack QA team doing in-depth testing beforehand, inevitably some program will eventually do something unexpected in production that requires debugging. And when such a problem happens in a multi-threaded CGI environment like Valence, determining which job to put into debug to diagnose the issue can be challenging when you’re using a 5250-based STRDBG session.

In Valence instances dedicated to development or testing, where little back-end action is taking place at any given moment, it’s usually a simple undertaking to identify which CGI job is operating as the “primary” job processing the calls. As described in a Valence forum post from 2011, in such cases you can simply start a service job on the CGI job handling the calls, then start a debug session on your program and step through it as normal.
But it’s a wholly different story when addressing logic problems occurring in production instances, where you may have dozens of different users making rapid-fire calls to back end RPG programs. In such environments it can be a rather hair-pulling exercise to guess which CGI job is going to process the call to your culprit program.
Of course, if you’re using RDi to handle your debugging tasks, setting up a Service Entry Point for this scenario is relatively straightforward. The debugger will automagically “grab” the appropriate CGI job for a particular user at your desired breakpoint.
But if your preferred interface for digging into your IBM i program logic is 5250-based, or you simply don’t have access to RDi, it can be a tricky guessing game to pick the correct CGI job to debug. If only it were possible to set a Service Entry Point on a green screen debugging session…
It turns out it is possible!
The key is to use a somewhat obscure command in STRDBG called SBREAK, which creates a Service Entry Point for a line in the program to catch any job that runs it under a specific user profile. The only caveat is you will need to use two separate 5250 sessions to achieve this — one to issue the Service Entry Point, then another to actually initiate the debugging process and step through the program. But it’s a small price to pay when you absolutely must get the job done using STRDBG in a busy production environment.
Here are the steps:
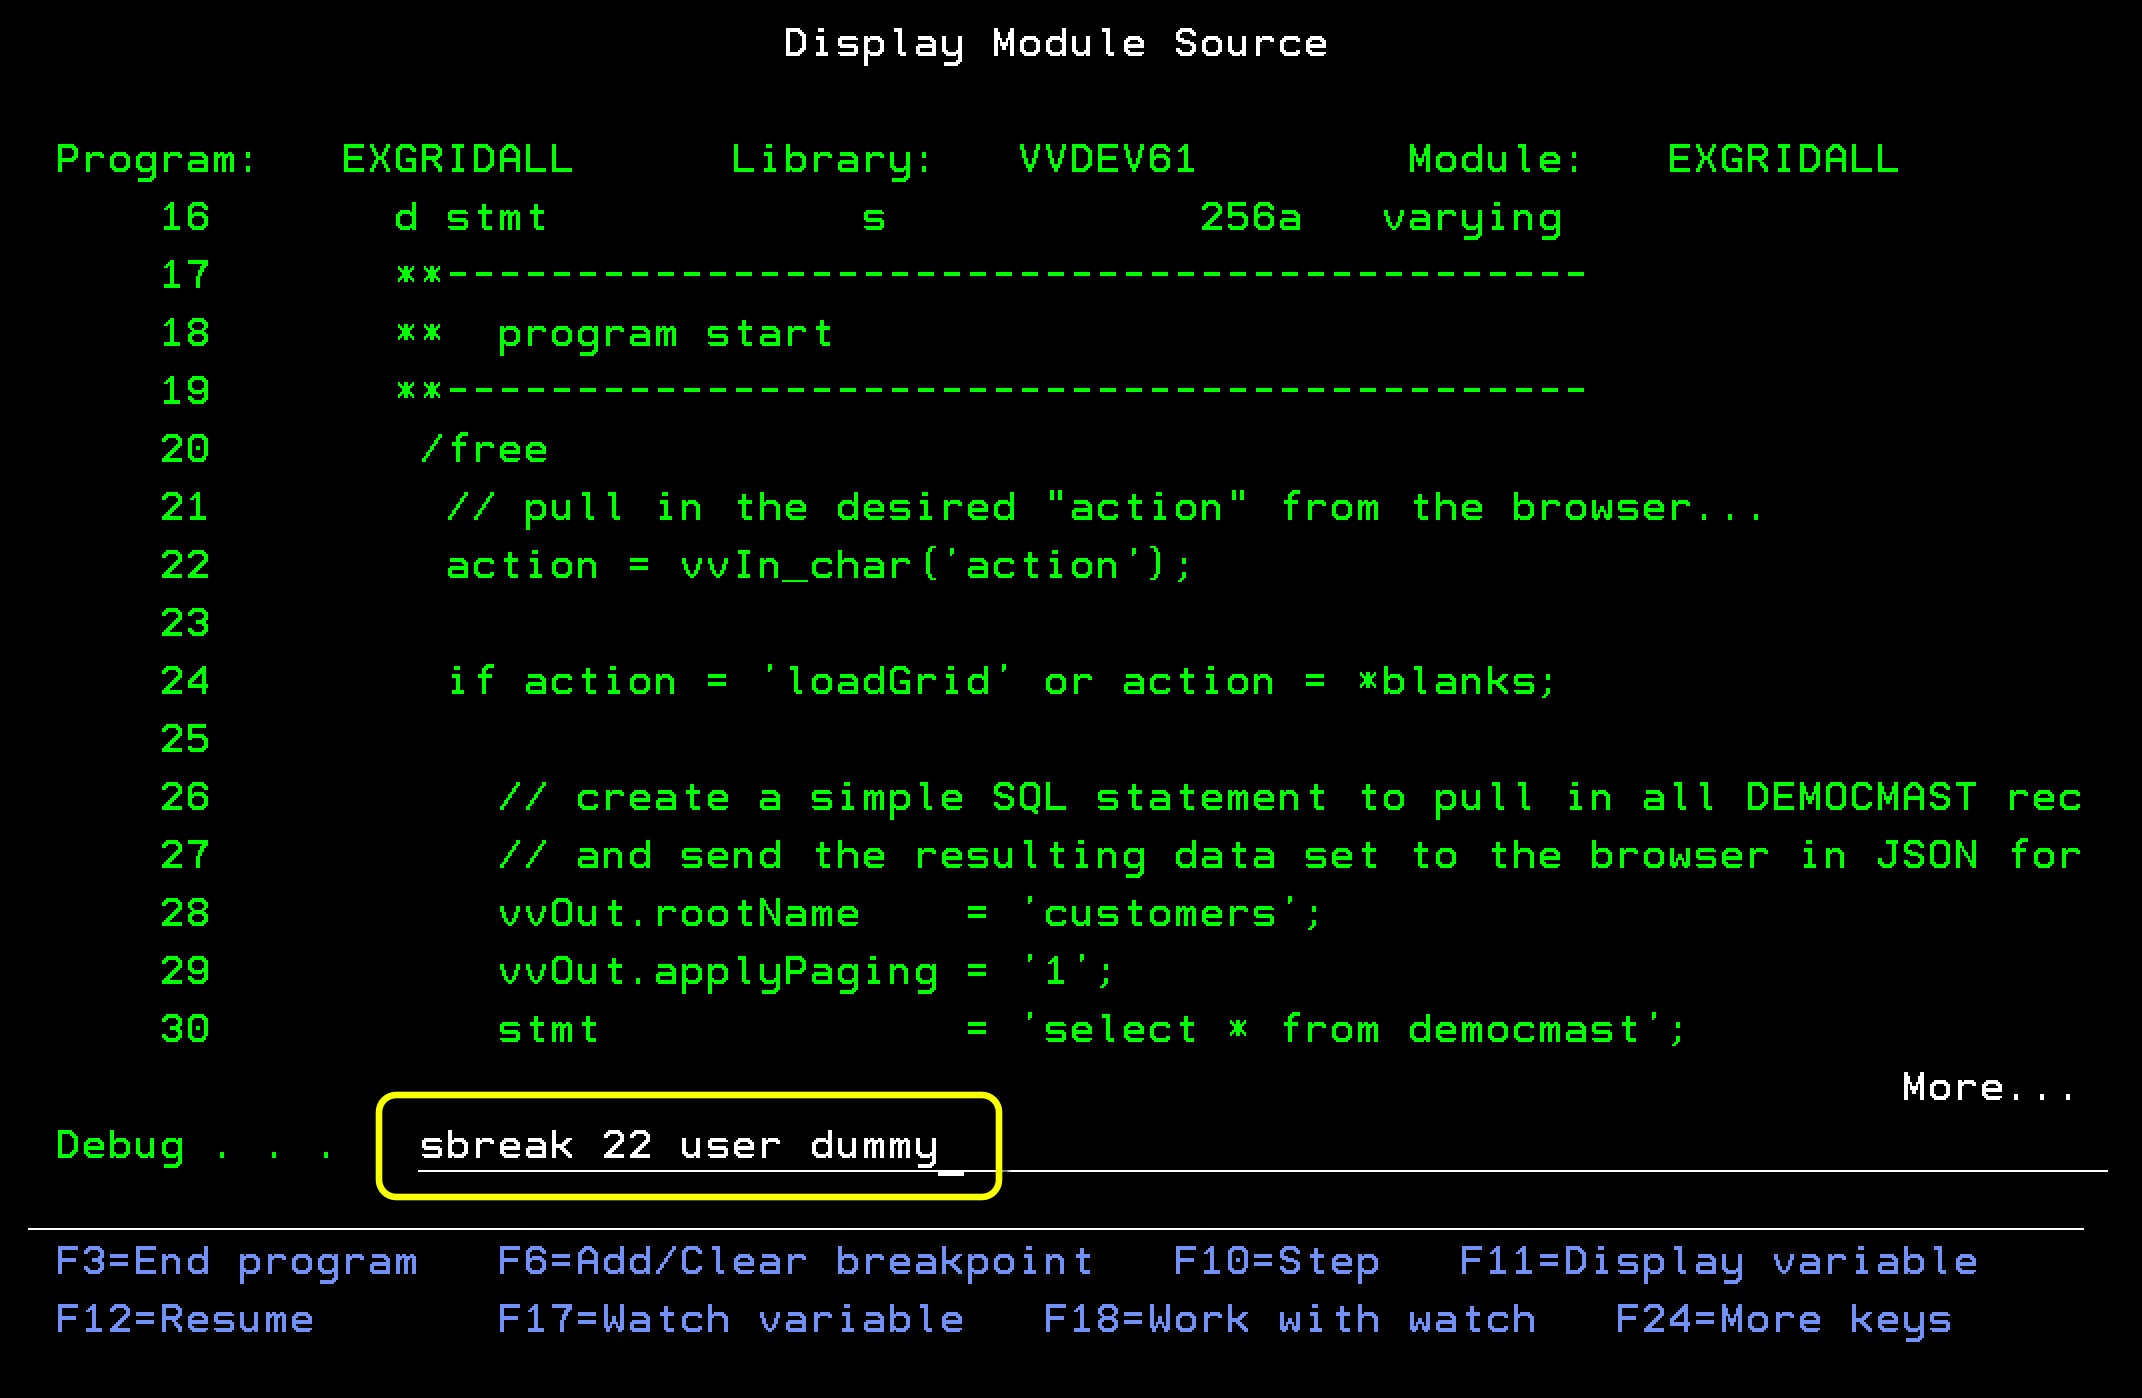
(1) Establish a Service Entry Point in session 1. You’ll initiate this process by using the STRDBG command on your first 5250 session to get into the desired program, the same way you would start to debug a program running interactively. Once you’re in the program, rather than setting a standard breakpoint at a particular line (i.e., by using the F6 key or the break command), you will instead issue a Service Entry Point using this command:
sbreak [line#] user [user ID]
Of course, you would replace [line#] here with the line number at which you want the service entry breakpoint established, and [user ID] with the IBM i user profile that will be calling your program in Valence. You can omit the user parameter if you’re logged in with the same IBM i profile that will be triggering the call in Valence. You can also use the abbreviated “sb” in place of “sbreak” if you’d like to save a few keystrokes, or impress your IBM i developers with a nifty debugger shortcut.
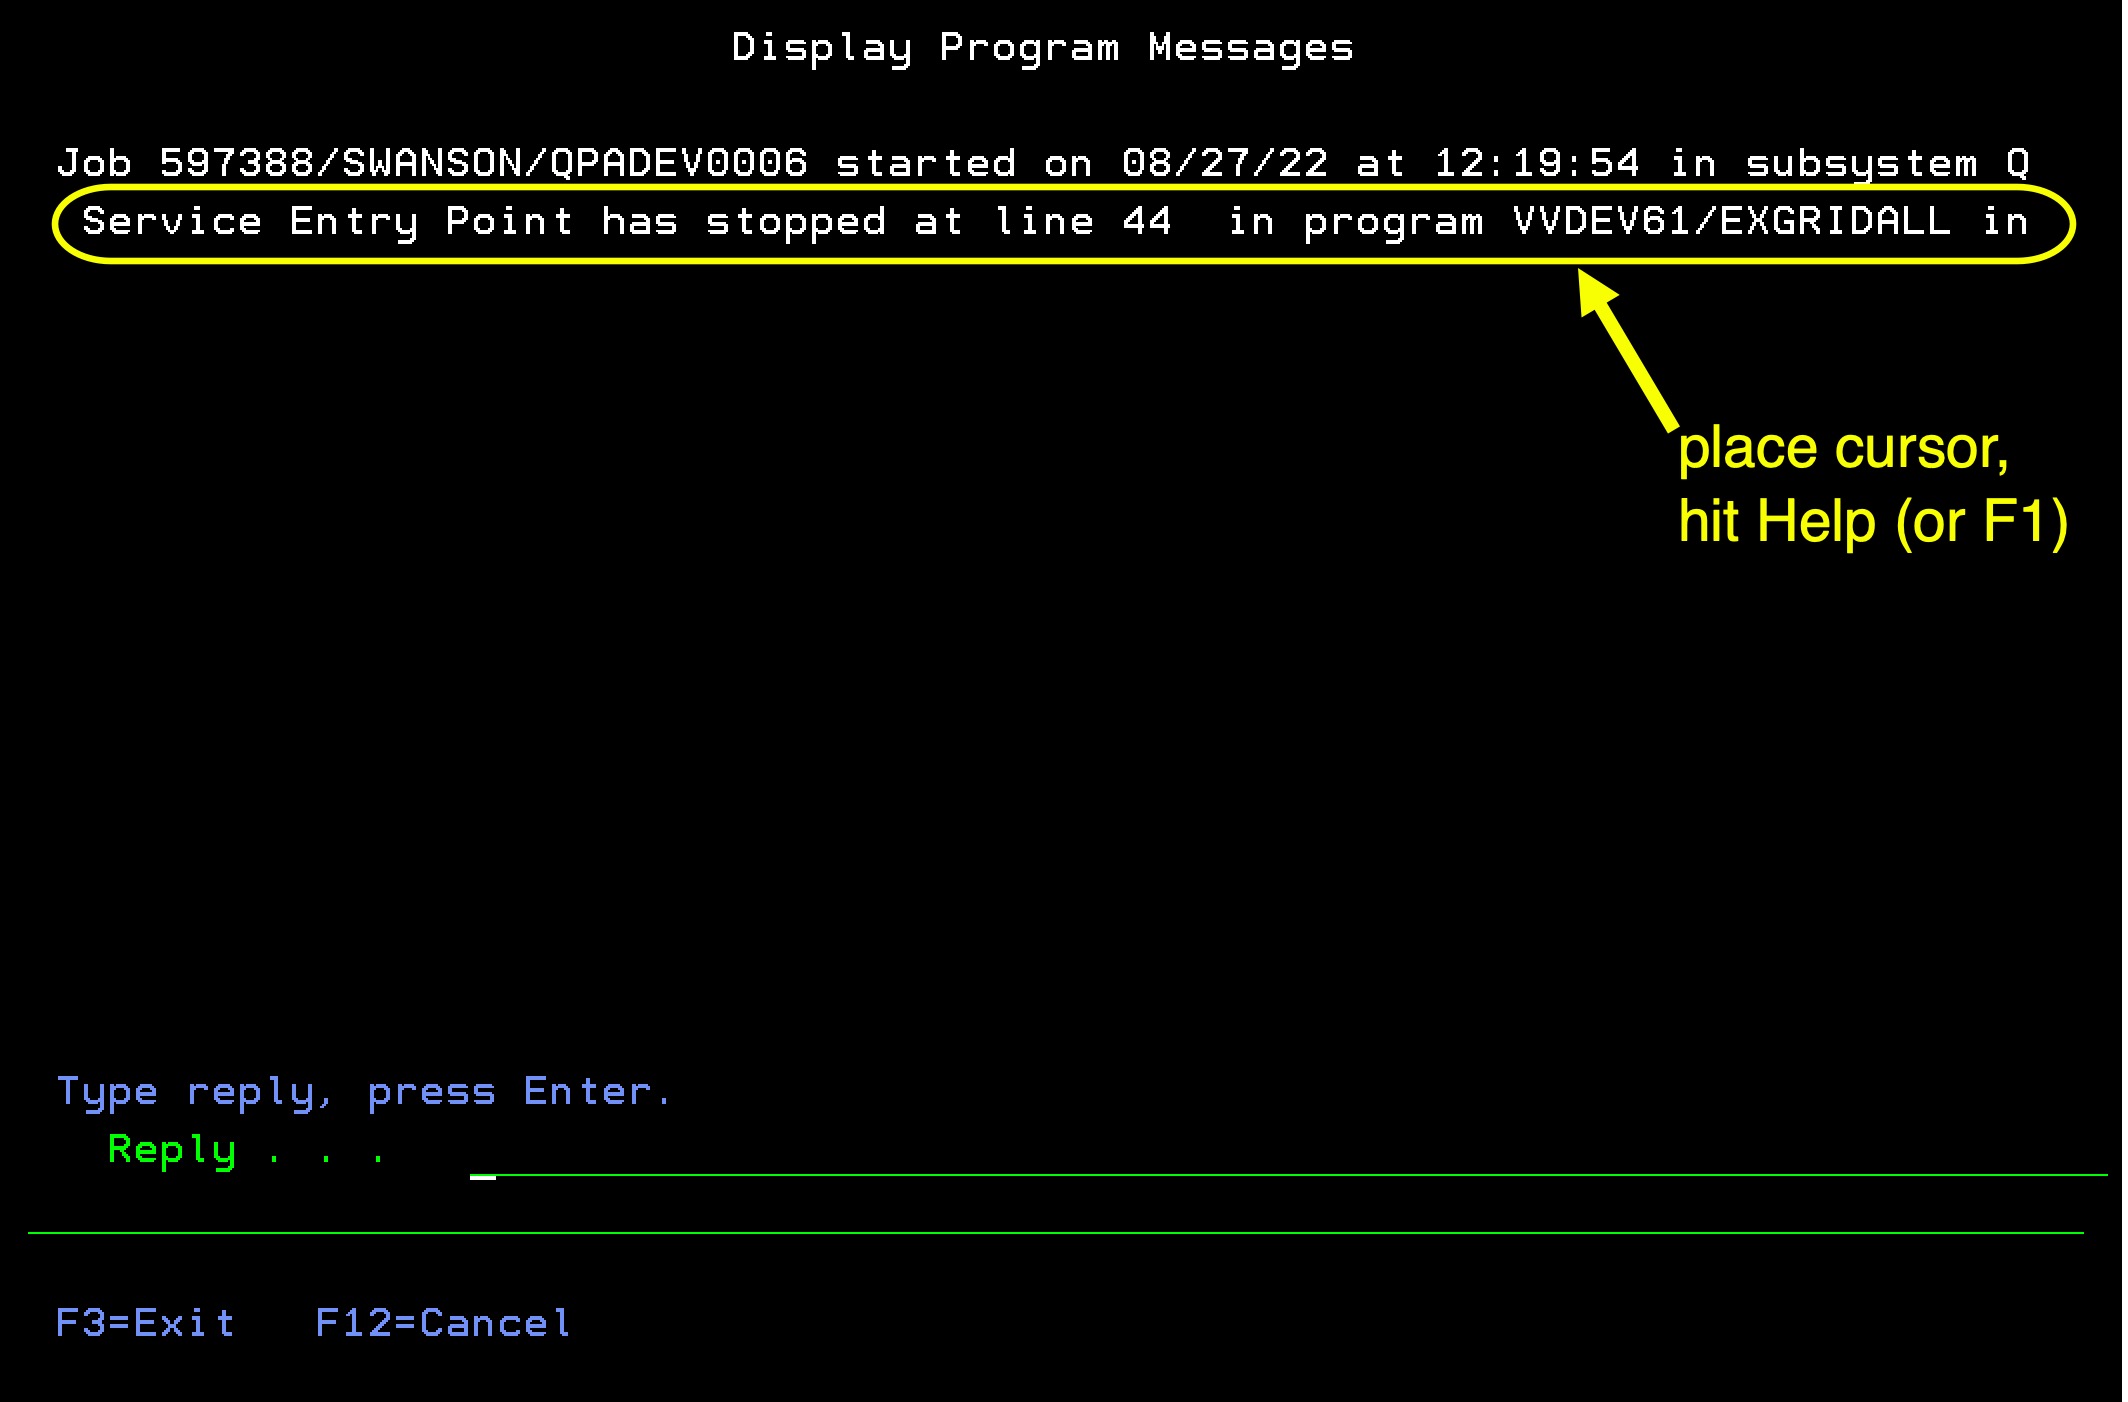
(2) Trigger the program call in the Valence app, then watch Session 1 for a break message. The user for which the SBREAK entry was established in step 1 should now take whatever action necessary to cause the program to be called. When the desired breakpoint is reached in the program, you will see a break message indicating the Service Entry Point has been triggered. Place your cursor over the message and hit Help (or F1) to get the message details…
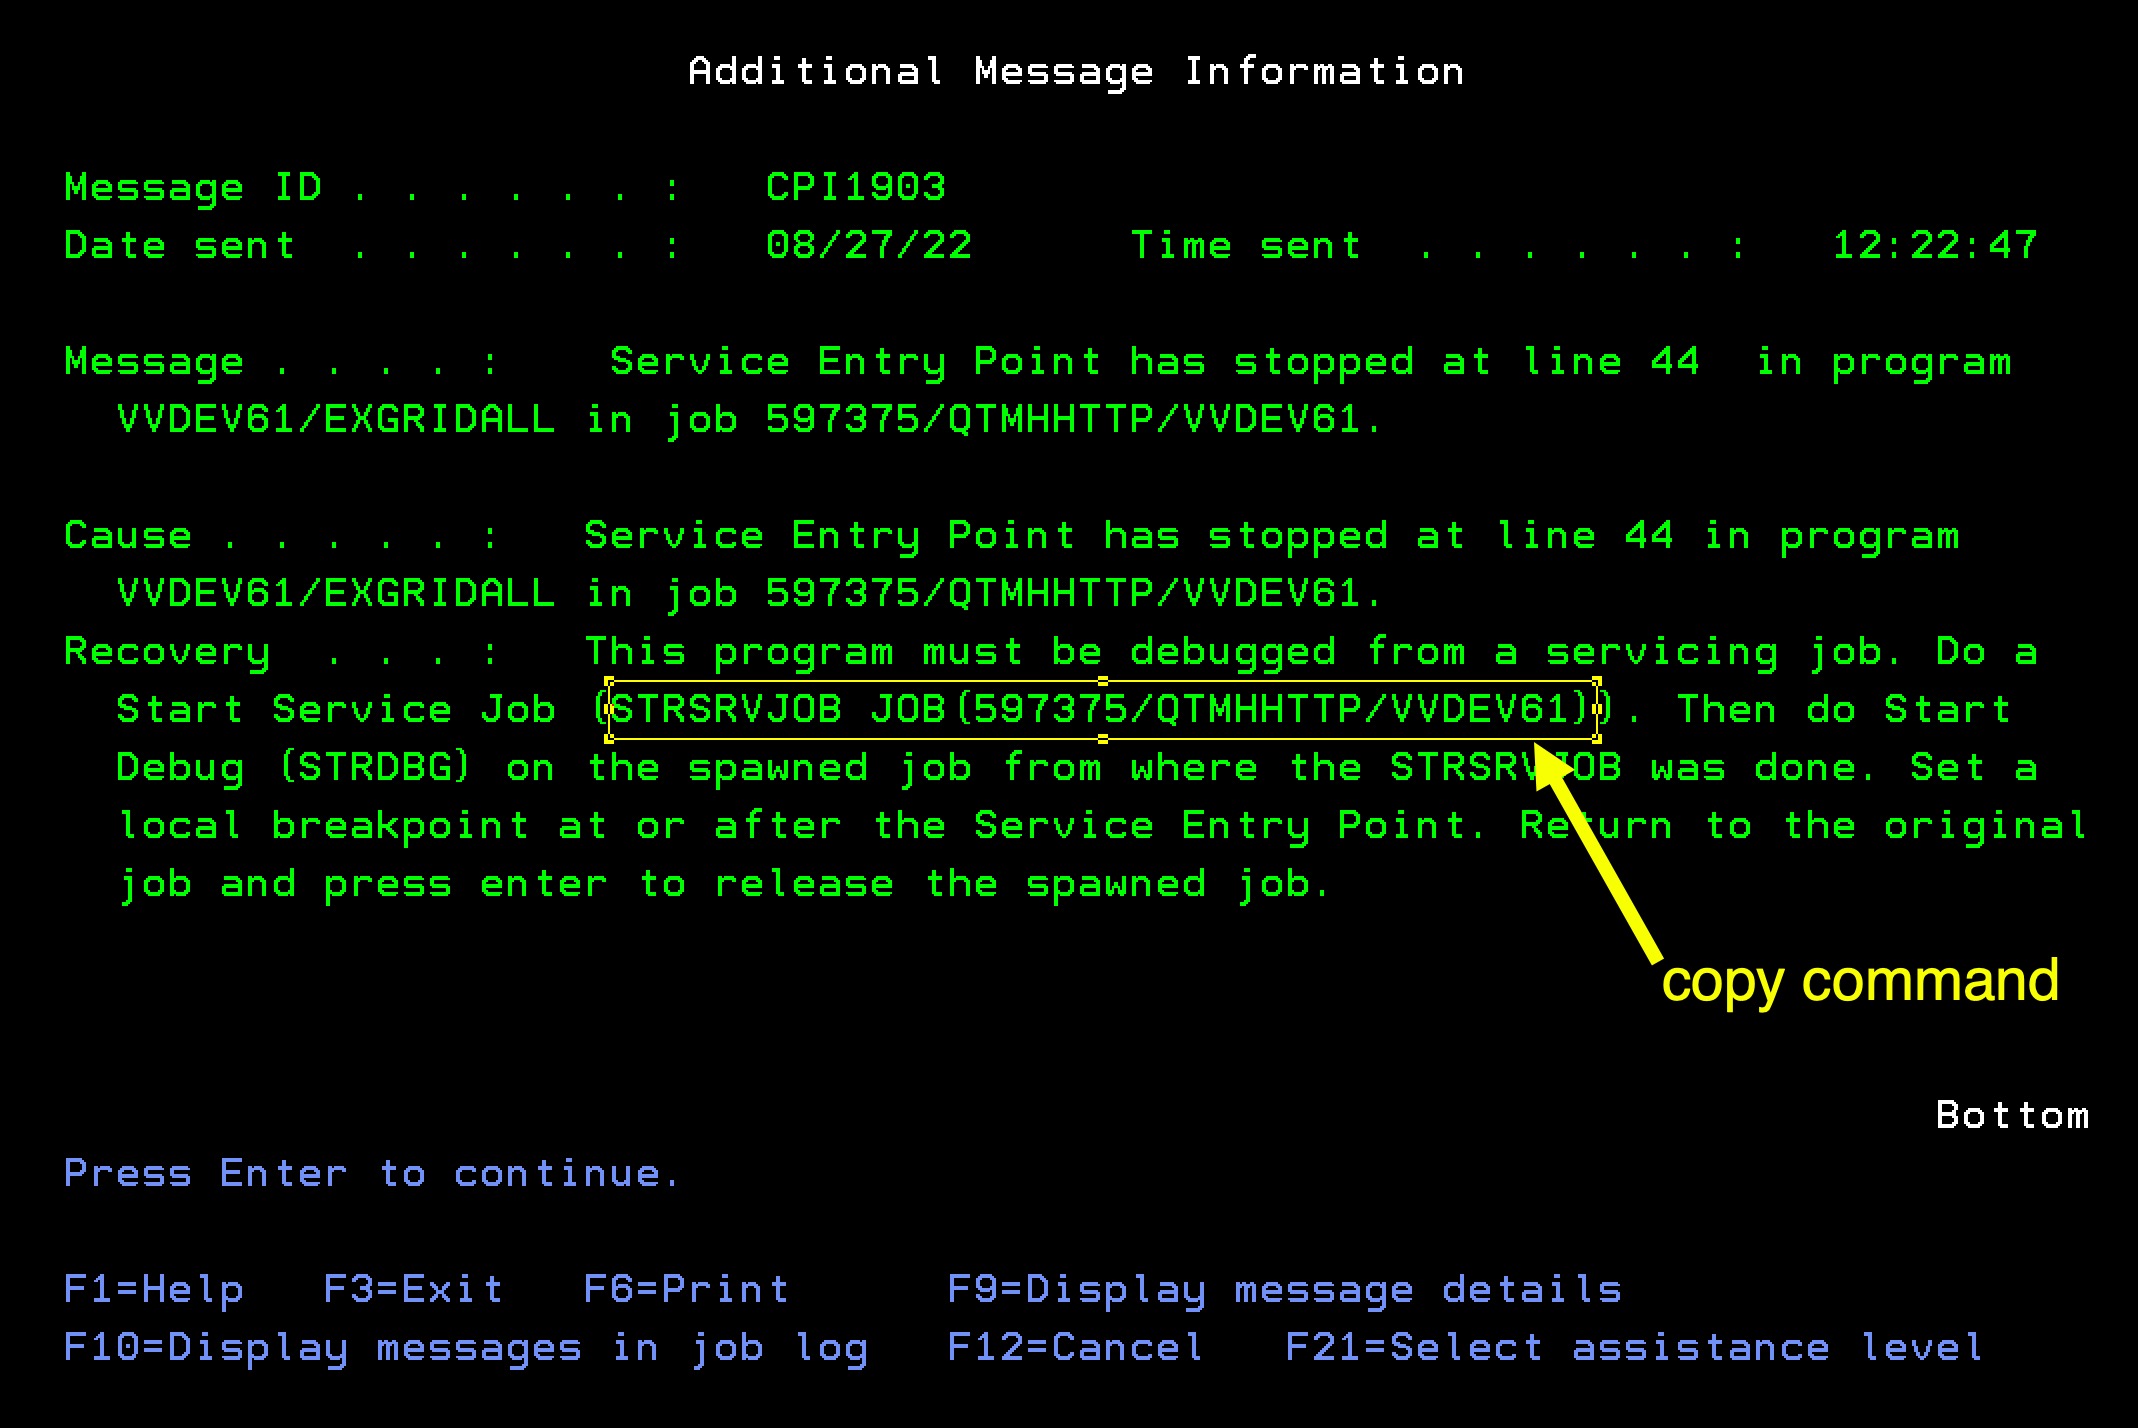
Copy the STRSRVJOB command shown in the detail text. We will use this in the next step.
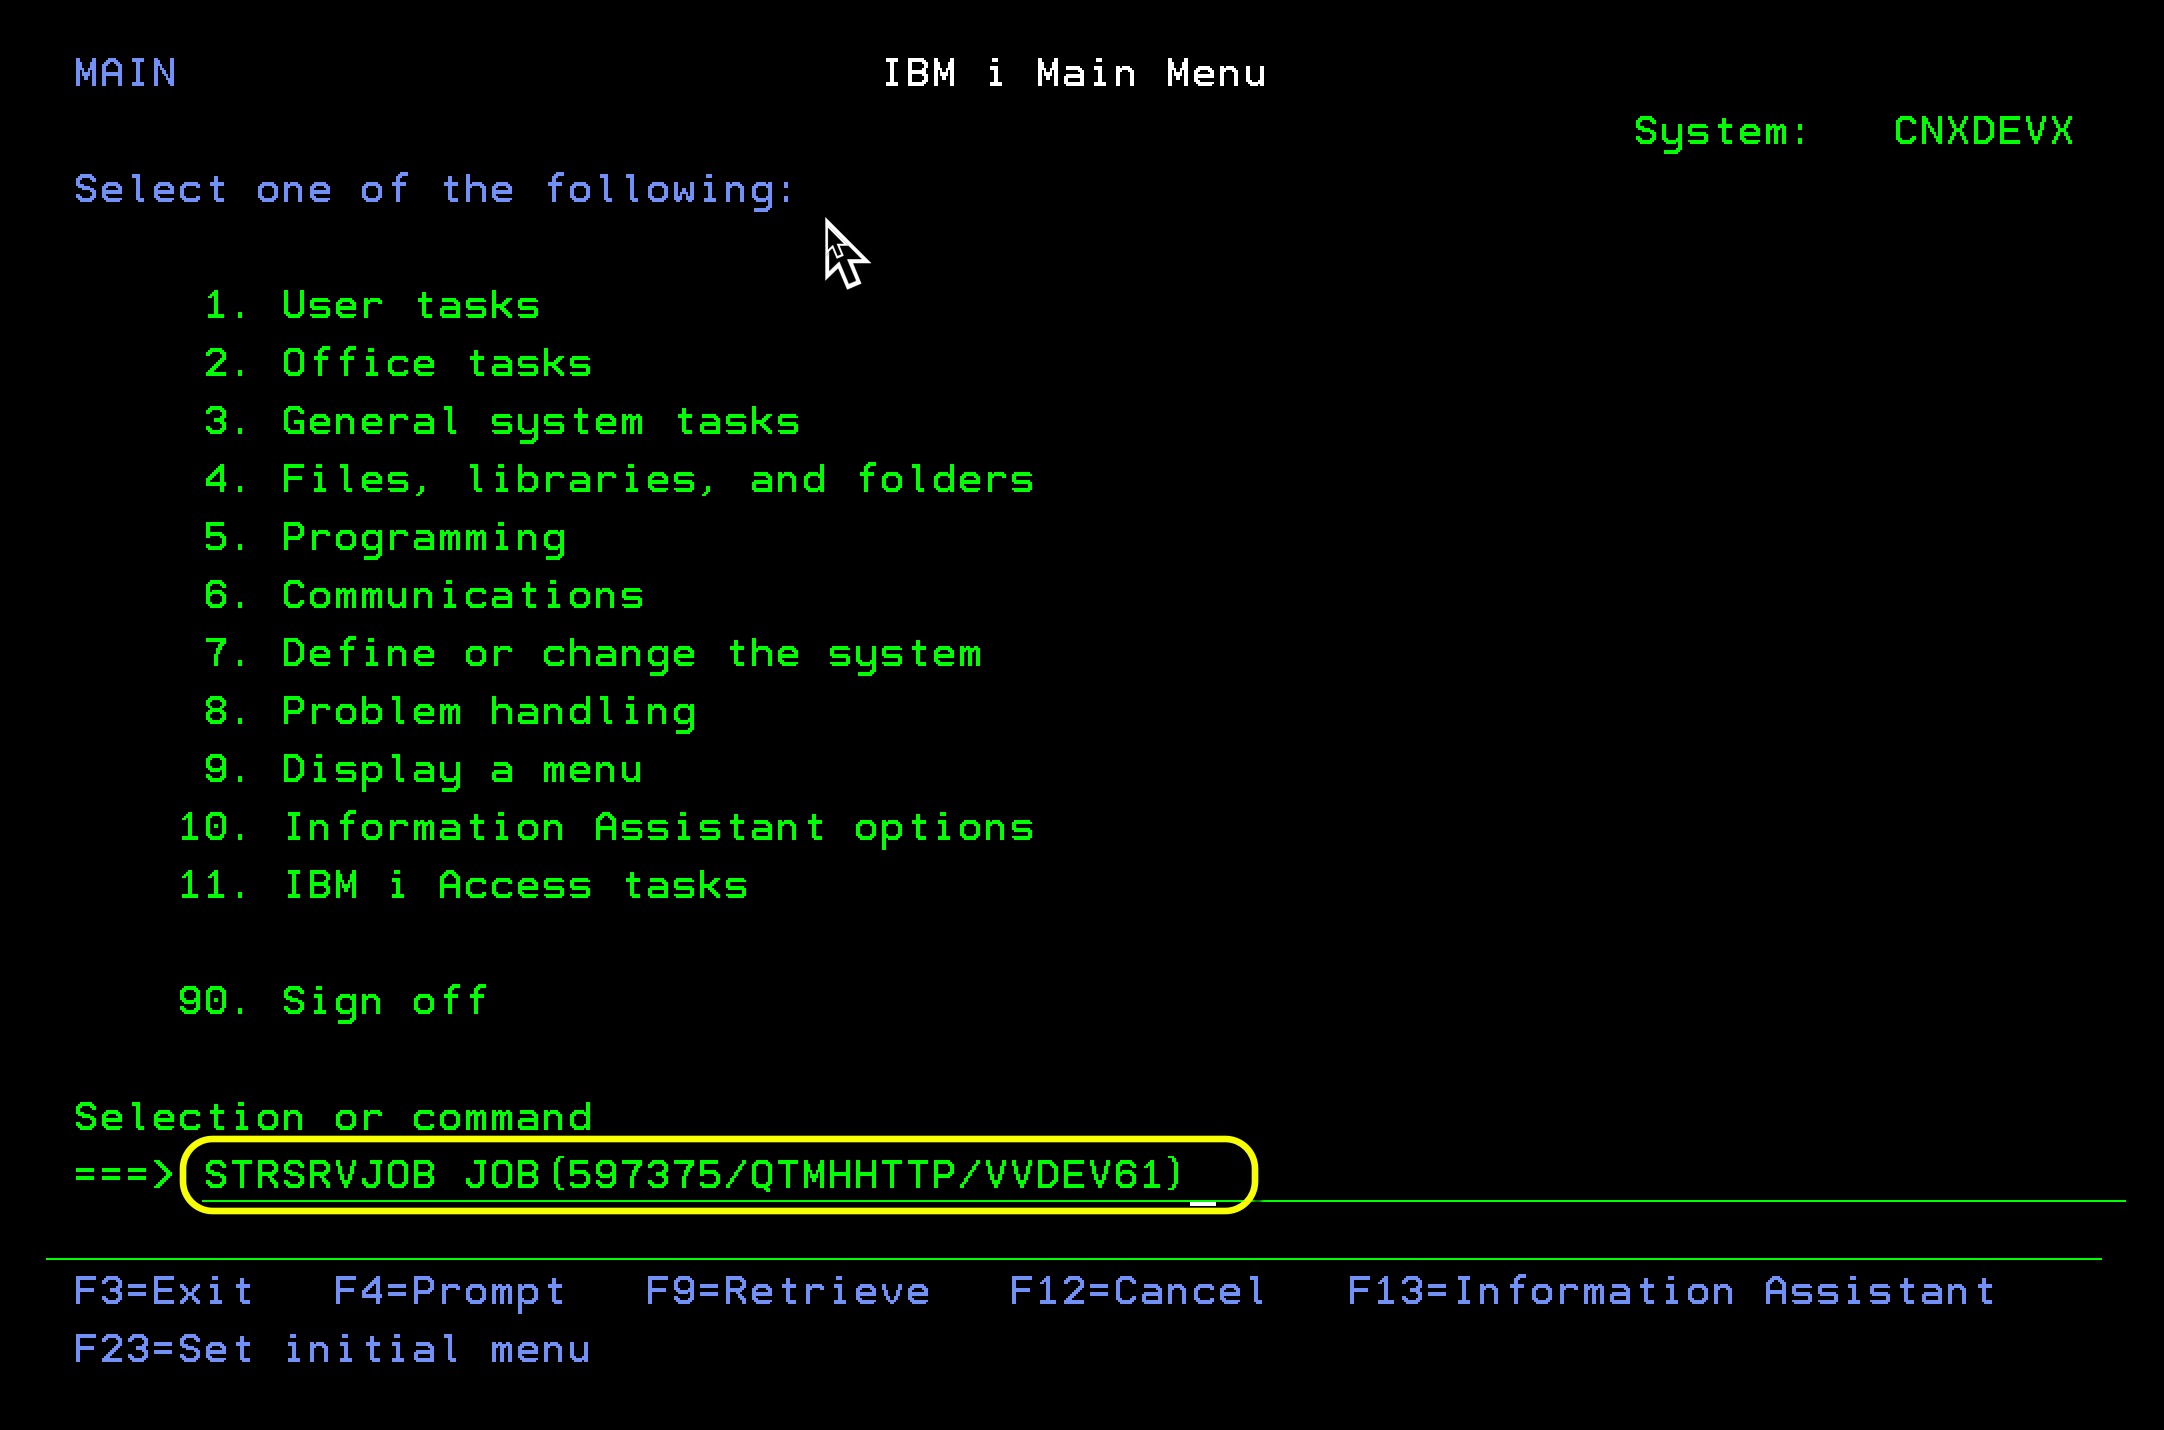
(3) Start a service job in session 2, using job info copied from the session 1 break message. Paste the STRSRVJOB text you just copied into a command line in your second 5250 terminal session. Note here that we’re servicing the job user for the job (QTMHHTTP), while we used SBREAK to catch the job being executed by the current user logged into the Valence instance (DUMMY).
(4) Start another debug session in session 2 for your “actual” debugging. This may seem a bit counterintuitive, but you now want to issue the STRDBG command over the same program again in your second terminal session, qualifying the program if necessary with the appropriate library name. Be sure to include UPDPROD(*YES) on the command to avoid triggering an exception message if production files are opened for update in the program. As this session is now servicing the desired CGI job, the debugger will be ready to receive action once you “unpause” it in your first 5250 session.
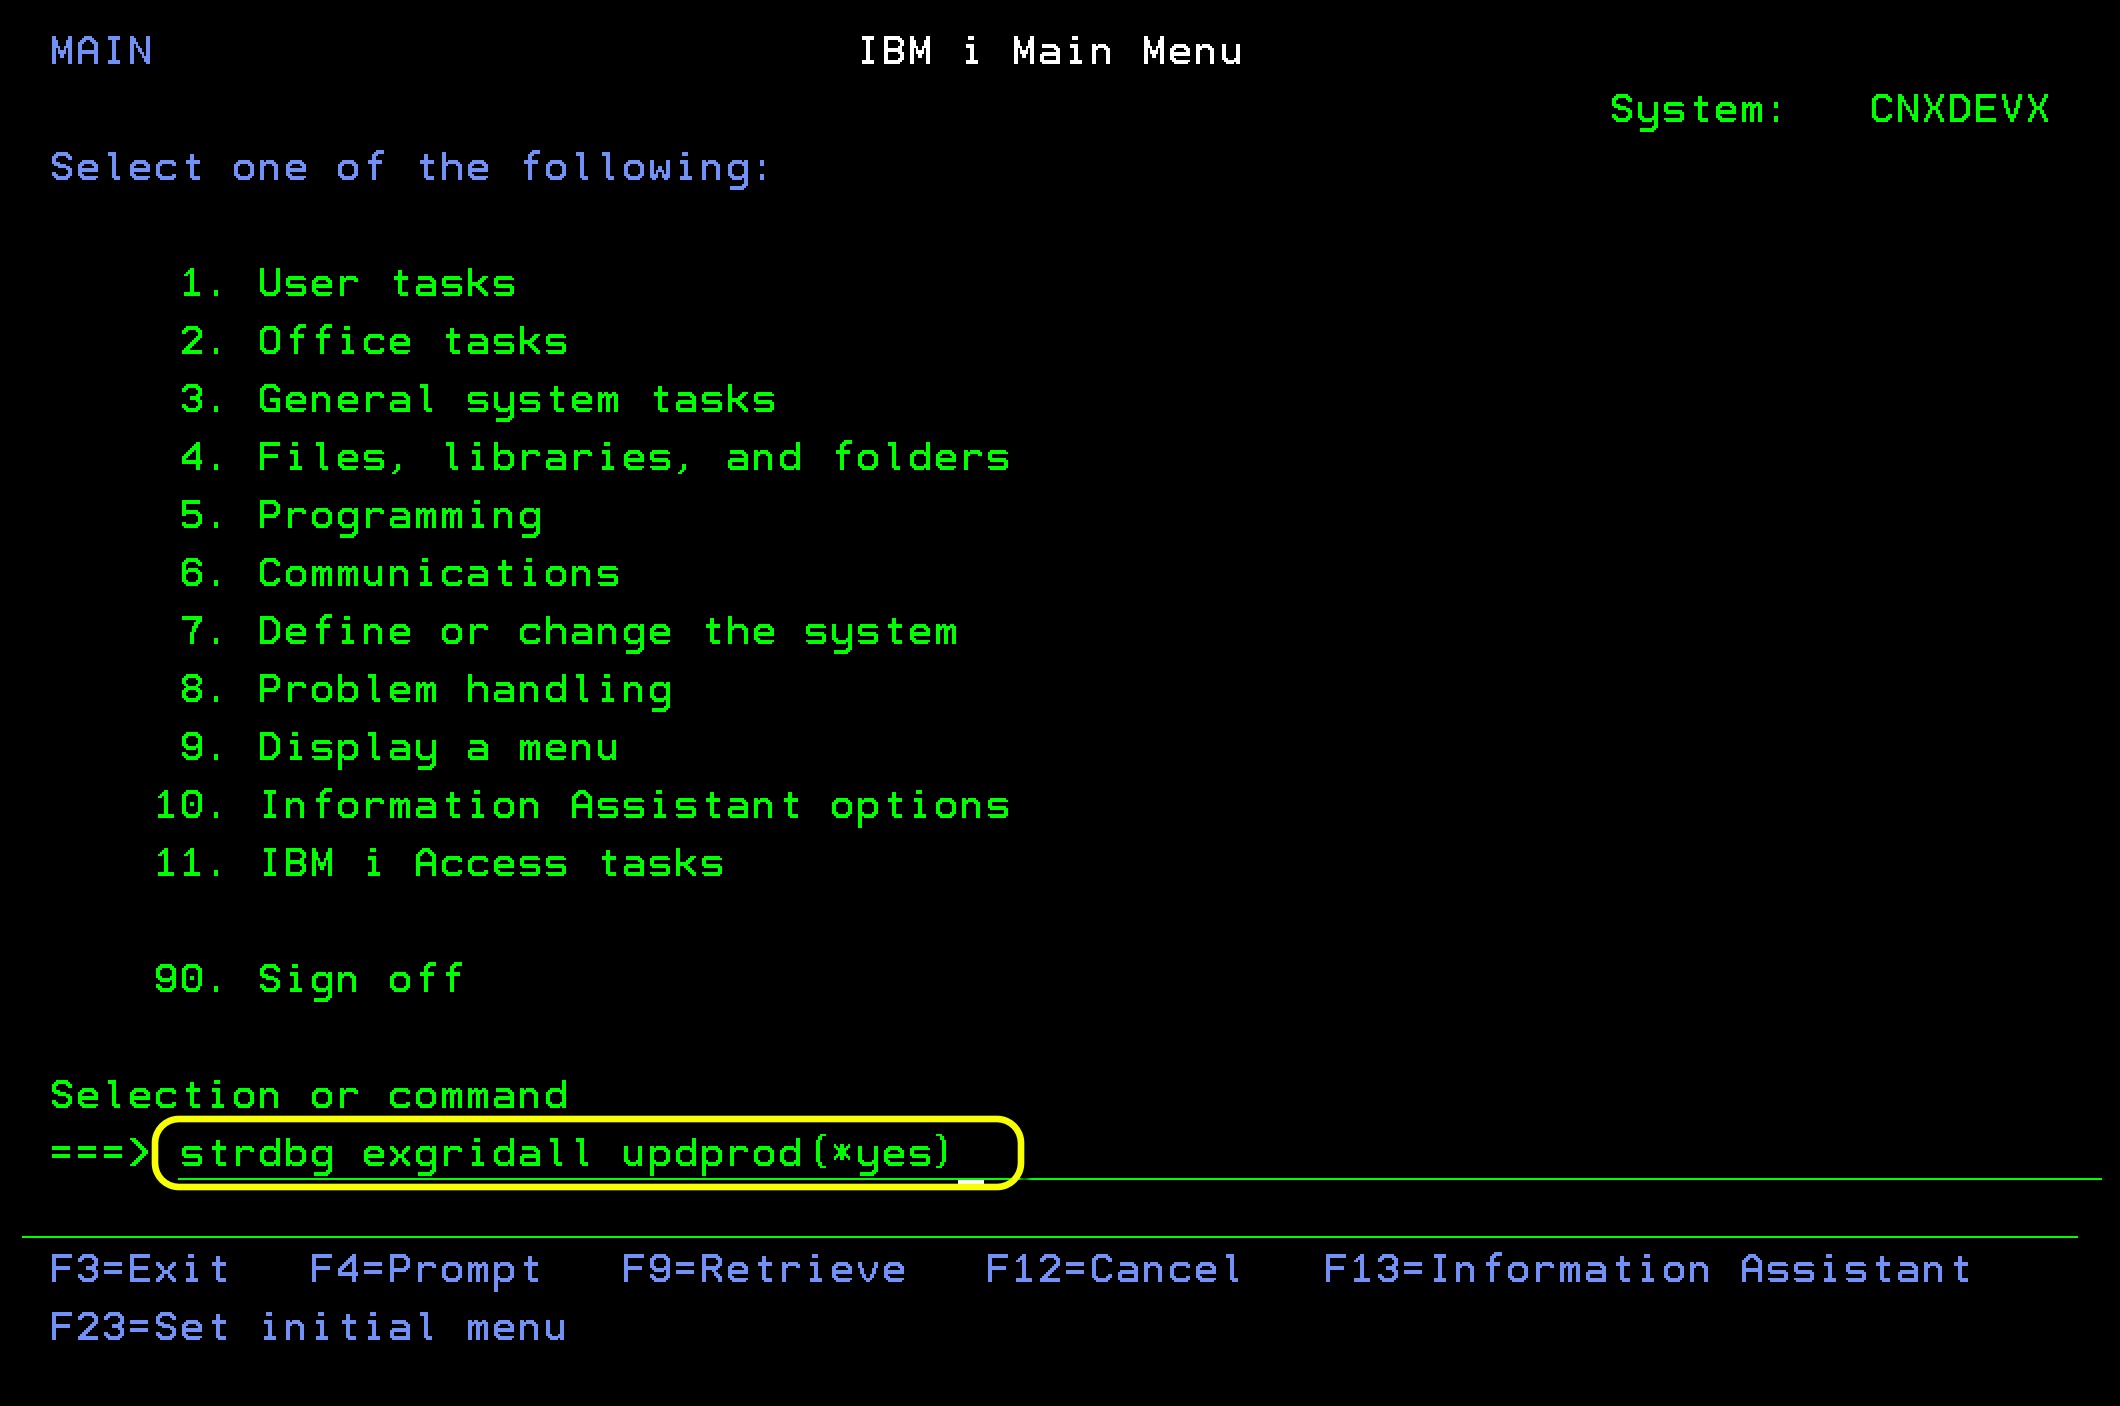
(5) Release the paused job in session 1, then begin debugging in session 2. Return to the first 5250 session where you issued the sbreak command and hit ENTER.
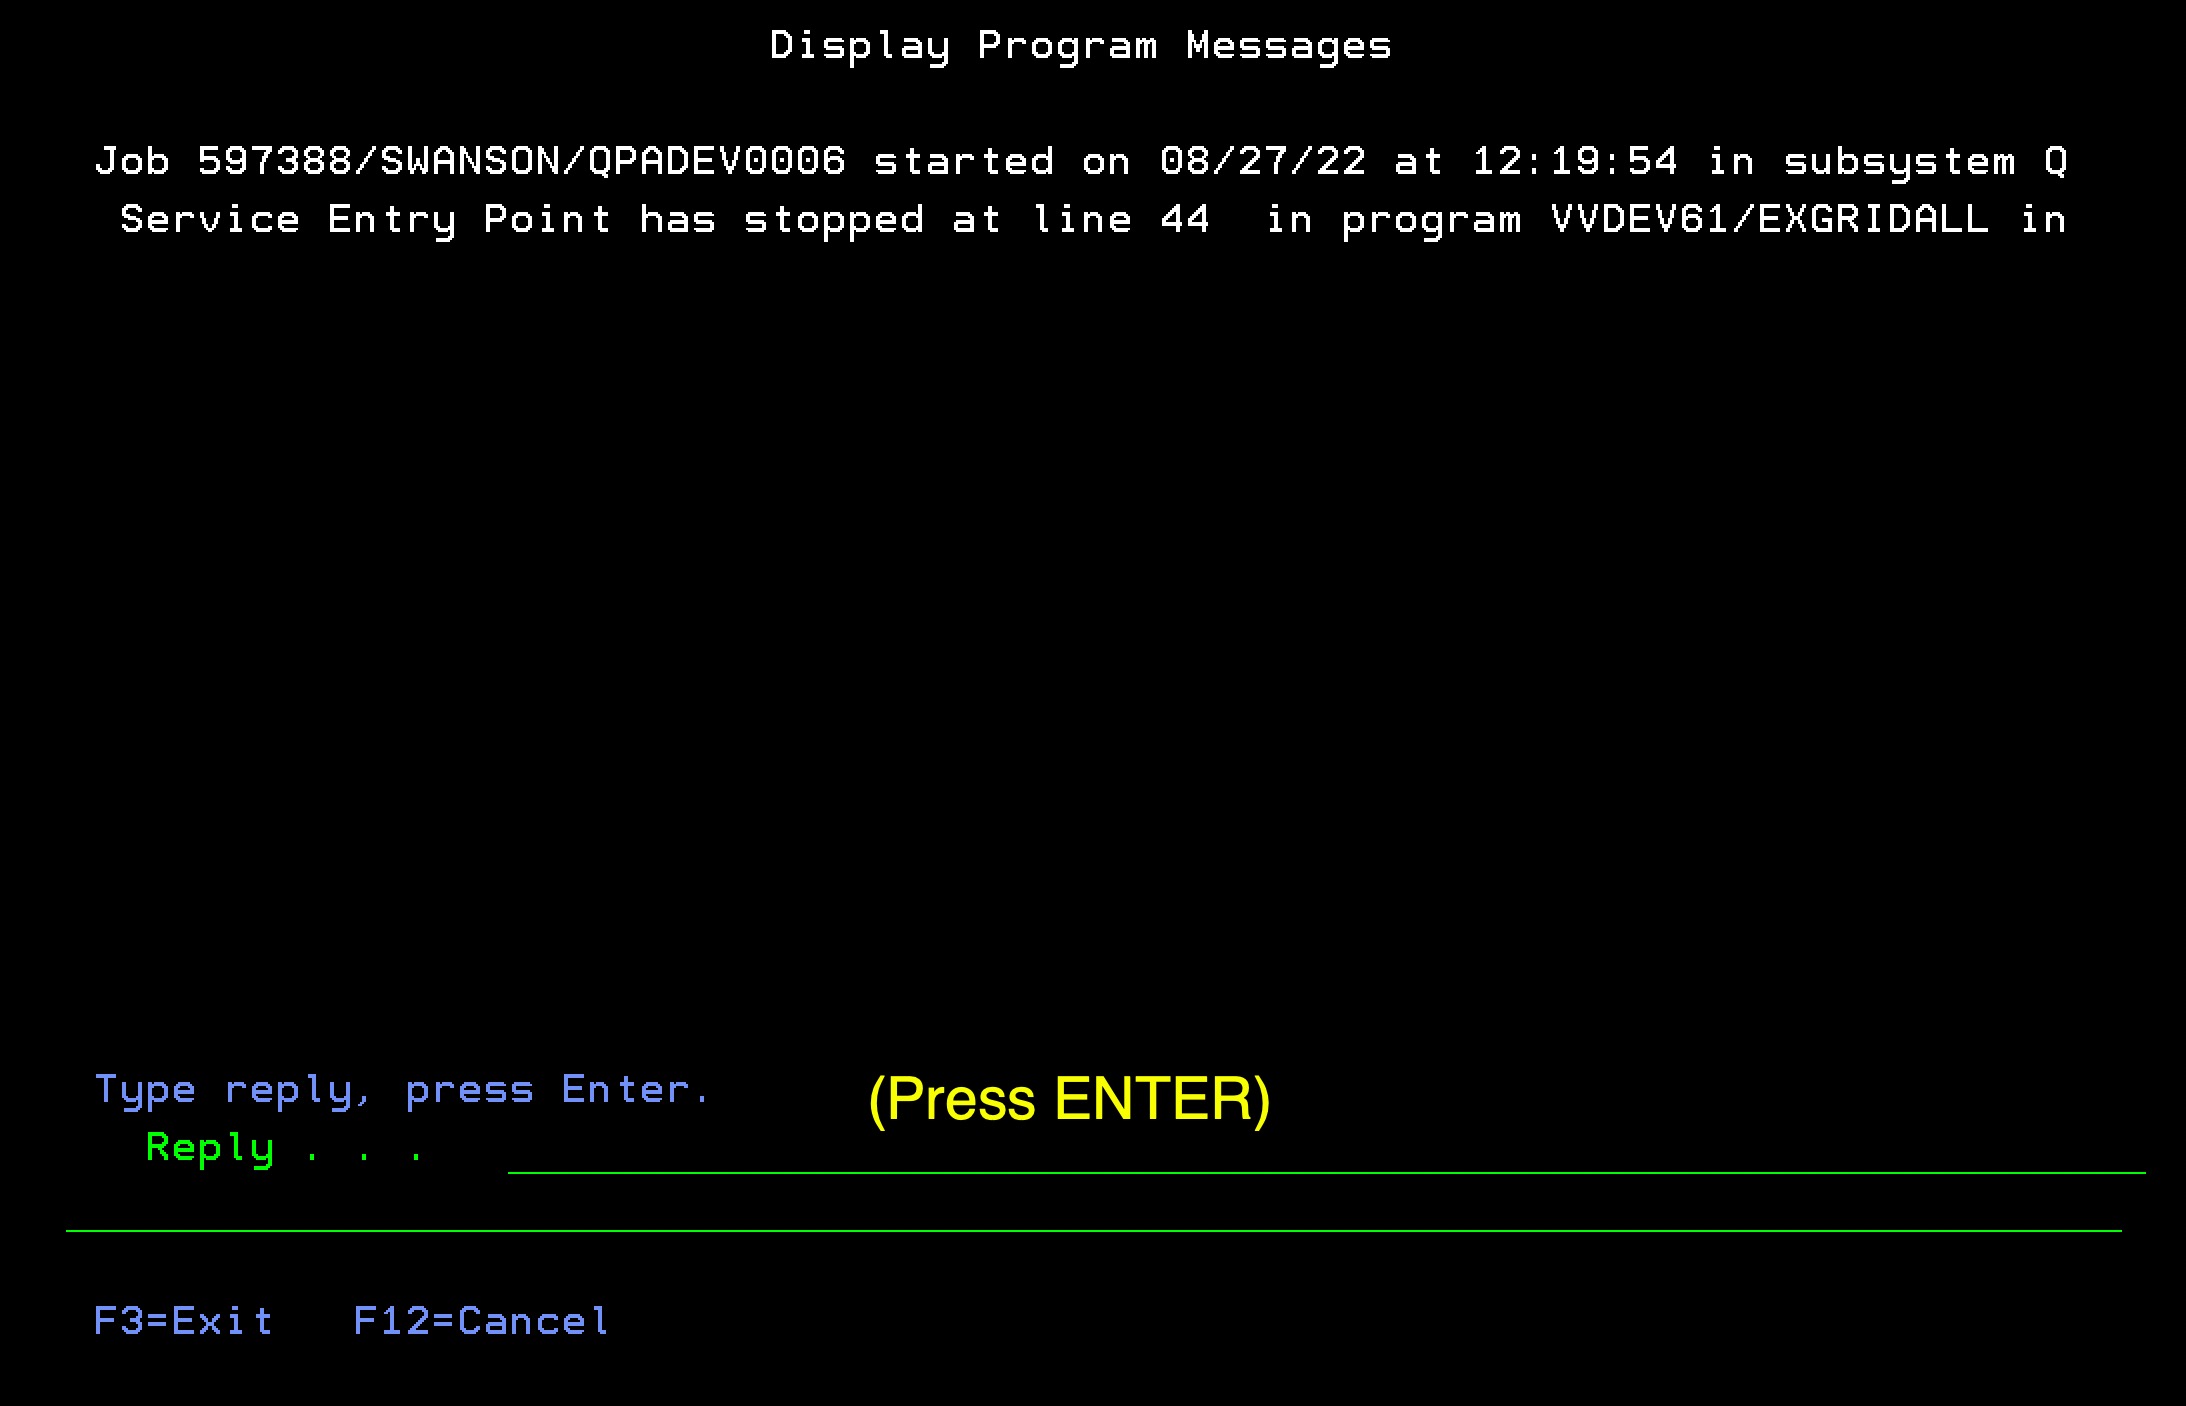
Your second 5250 session should then pop into a familiar debugging session, beginning at the line you specified in the sbreak command. You can now proceed to get to the bottom of your program’s logic problem.
At this point the first 5250 session is no longer needed. When you are done debugging in the second session, be sure to issue the ENDDBG command to terminate the debugging session, followed by ENDSRVJOB to release the service job. The service entry point issued in the first session remains active until you terminate the session or issue an ENDDBG command. If it’s still active you can repeat this debugging process again beginning at step 2.
As many have learned the hard way, forgetting to include UPDPROD(*YES) on the STRDBG command in step 4 will cause a fatal exception on the debug session if any file is opened for add or update on a production library anywhere in the call stack, forcing you to start the whole process over. If you have sufficient authority, you can avoid being bitten by this common omission by changing the default to the STRDBG command, as follows:
CHGCMDDFT CMD(STRDBG) NEWDFT('UPDPROD(*YES)')
A big hat-tip goes to forum user DanM for introducing us to this “advanced technique” in the 5250 debugger during a recent Zoom call!
![CNX_logo [Converted]](https://0pkef6.p3cdn1.secureserver.net/wp-content/uploads/2023/05/CNX_logo-Converted-2.png?time=1722004789)
![CNX_logo [Converted]](https://0pkef6.p3cdn1.secureserver.net/wp-content/uploads/2023/05/CNX_logo-Converted.png?time=1722004789)